Why Testing Muscle Is Different From Testing Fitness
The distinction between strength, mass, and function — and why each needs its own measure
You track your training load, your sleep, maybe even your heart rate variability — but do you actually know whether your muscle mass and strength are moving in the right direction? For adults over 35, the gap between feeling fit and being measurably resilient is wider than most realise, and the tests that reveal it are simpler than you think.
Here’s what catches even experienced athletes off guard: strength and mass are not the same thing, and they don’t always move together. You can carry adequate muscle mass on a scan and still produce force that falls below age-matched norms. You can feel strong in the gym and still have a skeletal muscle mass index that places you in a risk category for long-term physical decline. Low muscle strength and low muscle mass are independently and jointly associated with worse health outcomes — meaning you can have adequate mass but still be at risk if strength is compromised, and vice versa. That independence is what makes testing both separately so important. A training log tells you what you did. It doesn’t tell you what your body actually retained.
Function adds a third dimension. You might be strong and reasonably lean but move inefficiently under fatigue — a gap that shows up not in the gym but in clinical field tests designed to stress the whole system. Strength is what a muscle produces in isolation. Mass is what the scanner sees. Function is what happens when you ask both to work together under real conditions. Miss any one of these, and you’re making decisions with partial information.
The performance-longevity overlap: what Hyrox athletes and 60-year-olds have in common
The assumption is that performance athletes and longevity-focused adults are running different programmes toward different goals. At the level of muscle physiology, they’re managing the same underlying risk. After 35, the process of losing muscle mass and strength — called sarcopenia, the gradual age-related decline of skeletal muscle — begins quietly and accelerates if unchecked. The revised European consensus on sarcopenia confirms that strength and mass loss accelerate with the aging process, often without any subjective sense that it’s happening.
For the Hyrox or Ironman athlete, this matters because performance hits a ceiling when the underlying muscle quality degrades faster than training stimulus can compensate. For the person focused on moving well into their sixties and seventies, it matters because the window to build and preserve muscle mass is not indefinitely open. Both groups benefit from the same testing stack. Both groups are flying partially blind without it.
The Core Tests — What to Measure and Why
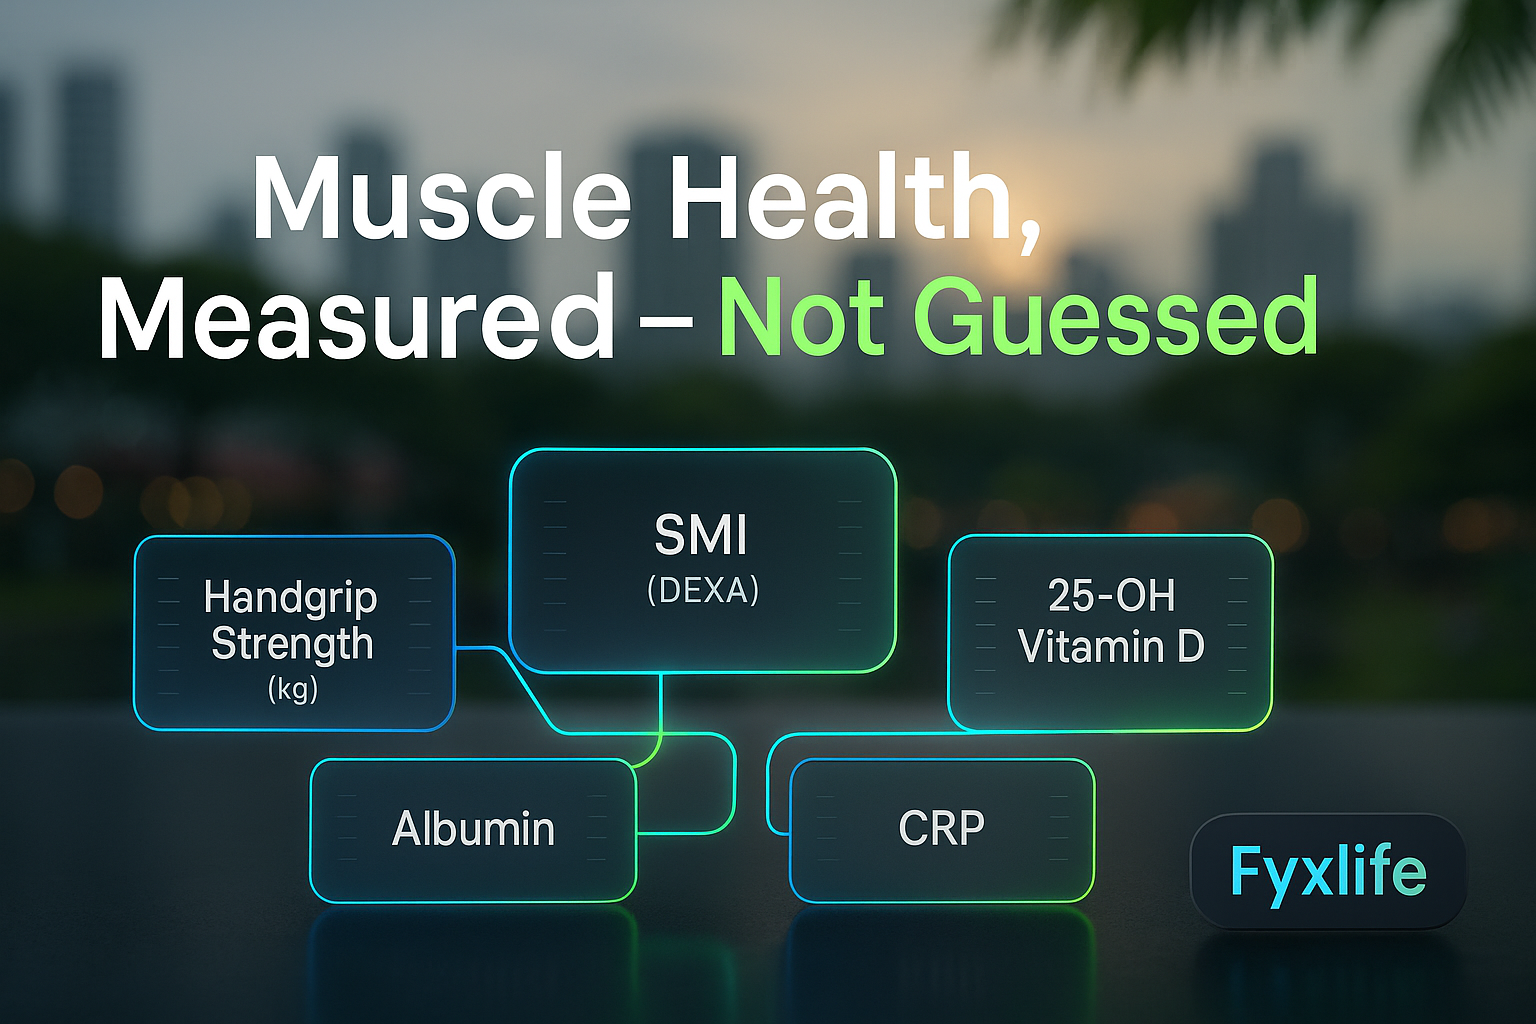
Think of your muscle health panel like a car’s dashboard warning system. The engine light alone doesn’t tell you what’s wrong — you need oil pressure, temperature, and battery readings together to know whether to pull over now or just schedule a service. A single gym metric like how much you bench press is the engine light. Handgrip strength, skeletal muscle mass index, vitamin D, and CRP are the full dashboard. You need all of them to know what’s actually happening under the hood.
Test 1 — Handgrip Dynamometry (strength proxy, biological age signal)
Handgrip dynamometry — squeezing a calibrated device that measures the force your hand can produce, expressed in kilograms — sounds deceptively simple for something carrying this much predictive weight. It is the most validated, accessible, and cost-effective proxy for whole-body muscle strength currently available in clinical and sports medicine settings. Handgrip strength and skeletal muscle mass index are used as validated assessment parameters for muscle strength and mass in clinical populations. What it’s actually measuring is your neuromuscular system’s ability to recruit and coordinate force — a reflection of systemic muscle quality, not just what your forearm can do.
In Singapore, many physiotherapy practices and sports medicine clinics offer dynamometer testing for under $30. It takes under two minutes. The result is one of the most information-dense numbers you can get for that investment.
Test 2 — DEXA Scan or BIA — measuring skeletal muscle mass index (SMI)
Body composition testing gives you a number that gym scales and mirrors cannot: your skeletal muscle mass index (SMI), which is the ratio of your appendicular lean mass (the muscle in your arms and legs) to your height squared. This is how clinicians assess whether you have enough functional muscle relative to your frame — not whether you look lean.
A dual-energy X-ray absorptiometry scan (DEXA) is the gold standard, distinguishing bone, fat, and lean mass with precision. Bioelectrical impedance analysis (BIA) — the body composition scales found in many gyms and clinics — estimates the same data using electrical resistance and is a reasonable proxy if DEXA isn’t accessible. Baseline skeletal muscle mass and dynamic changes in it over time serve as meaningful prognostic signals — low baseline muscle mass alone predicts risk of impaired physical performance. That last point matters: the value of your first scan is not the result itself, it’s establishing the baseline against which every future scan is compared.
Test 3 — Gait Speed and the 400m Walk Test (functional performance)
Gait speed — how fast you walk across a fixed distance under normal conditions — is a clinical measure, not a fitness test. It captures the integrated output of your muscular, neurological, and cardiovascular systems working together. The 400m walk test extends this to a distance that exposes fatigue effects invisible in short-distance assessments. Validated physical tests used in clinical sarcopenia diagnosis include the 400m walk test and the 6-minute walk test, alongside strength and mass measures. For performance athletes, these numbers feel almost insultingly easy — until they sit alongside handgrip and SMI data and you see the full picture.
Test 4 — Blood Panel: Vitamin D (25-OH D3), Albumin, Irisin, PTH, and CRP
This is where most standard health screens leave significant information on the table. The blood markers that most directly reflect muscle health are rarely grouped together, and some — like irisin (a hormone secreted by muscle tissue during exercise, now understood as a messenger that signals muscle and metabolic health) — are not yet part of routine GP panels at all.
A composite biomarker test combining irisin, 25(OH)D3, and albumin has been developed as a combined indicator of muscle strength and mass status. Each tells a different part of the story. 25-OH vitamin D (the active circulating form of vitamin D measured in the blood) affects muscle protein synthesis directly. Albumin — a protein produced by the liver — reflects nutritional status and systemic stress, both of which affect muscle maintenance. Parathyroid hormone (PTH) — the hormone your body releases when calcium or vitamin D levels fall — rises as a compensatory signal and can drive muscle deterioration when chronically elevated. Low levels of vitamin D and high PTH levels have been shown to be significant determinants of loss of muscle strength and muscle mass — and both are routinely missed in standard screens. Finally, CRP (C-reactive protein) — a marker of whole-body inflammation produced by the liver — connects the inflammatory picture to muscle tissue directly. Higher systemic inflammation is linked to lower muscle strength and lower muscle mass, with monocyte counts suggested as a relevant inflammatory indicator.
How to Interpret Your Results
Handgrip benchmarks by age and sex — where do you actually sit?
For men aged 35–44, a handgrip strength above 44kg in the dominant hand is considered robust. Below 32kg is a recognised low-strength threshold. For women in the same age bracket, above 27kg is the target; below 20kg is clinically flagged. These numbers shift downward with each decade. The recurring finding in fitness communities — that people who train consistently for years are surprised to discover their actual strength metrics fall below age-matched norms when formally tested — is not an anomaly. Training volume does not guarantee training quality, and subjective strength in familiar movements does not translate directly to standardised force output.
Reading your DEXA or BIA output beyond body fat percentage
When your DEXA or BIA result comes back, resist the pull of the body fat percentage number and go straight to your appendicular lean mass (the combined muscle mass of your arms and legs). Divide that number by your height in metres squared to get your SMI. For men, an SMI below 7.0 kg/m² and for women below 5.5 kg/m² meets the threshold for low skeletal muscle mass in European clinical criteria. Your scan report may not calculate this for you. Request the raw appendicular lean mass figure and do the division yourself.
Blood marker reference ranges that matter for muscle health specifically
For vitamin D, a level above 75 nmol/L is the target for muscle function — not the 50 nmol/L threshold many labs use as their lower reference. Below 50 nmol/L is where muscle-related effects begin to accumulate. Albumin should sit above 40 g/L; anything consistently below 38 g/L in the context of fatigue or strength plateau warrants investigation. CRP below 1 mg/L reflects low inflammation; between 1–3 mg/L is borderline; above 3 mg/L alongside any muscle health signal is a combination worth acting on. PTH ideally sits in the lower half of the normal range — elevated normal PTH alongside low vitamin D is the combination that most frequently slips through routine screening.
The red flag combinations: when two marginal results together signal real risk
Individual results sitting just outside the optimal range can be easy to dismiss. Combinations are where the real signal lives. Low-normal vitamin D plus elevated PTH tells you your body is compensating for a deficiency the blood test alone might not flag as urgent. Handgrip strength at the lower quartile for your age plus a CRP above 3 mg/L is the dashboard showing both degraded output and an active inflammatory driver. Increased levels of frailty-associated biochemical markers are associated with lower handgrip strength and lower muscle mass, and are elevated by both chronic and acute conditions — which means a single elevated marker after illness is different from the same marker elevated consistently at rest. Context matters, but combination matters more.
When to Test and How Often
Baseline testing protocol — the first panel to run
Your first priority is establishing your baseline. Run the full panel before you change anything: handgrip dynamometry, a DEXA or BIA body composition scan, your blood markers (25-OH D3, albumin, PTH, CRP), and a timed 400m walk if you want the functional data point. This is not about finding pathology. It is about creating the reference point against which every future measurement is meaningful. Do this once, document it precisely, and store it somewhere accessible.
Retesting frequency: performance athletes vs. longevity-focused adults
For performance athletes — particularly those in active training blocks for Hyrox, marathon, or Ironman — retesting handgrip strength and blood markers every six months aligns with training periodisation cycles and catches depletion patterns before they affect performance. DEXA or BIA every twelve months is sufficient unless you are in a significant body composition change phase. For longevity-focused adults not in structured athletic programmes, annual testing across all markers is a reasonable cadence, with blood markers potentially run more frequently if any single value was borderline at baseline.
What counts as a meaningful change vs. normal variation
Handgrip strength fluctuates by up to 10% between testing sessions depending on fatigue, hydration, and time of day. A meaningful change is a consistent shift of more than 10% across two tests conducted under similar conditions, or a directional decline over two consecutive annual tests. For SMI, any decline greater than 0.3 kg/m² over twelve months is clinically significant. For blood markers, a vitamin D drop of more than 15 nmol/L between comparable seasons, or a CRP that moves from below 1 to above 3 mg/L without an acute illness explanation, both warrant investigation rather than passive monitoring.
What to Ask Your Doctor
The exact tests to request and the framing that gets results
At your next GP or blood test visit, ask for the following by name:
- 25-OH Vitamin D (specify 25-hydroxyvitamin D3, not D2)
- Albumin
- CRP (high-sensitivity CRP if available)
- Parathyroid hormone (PTH)
- Referral for DEXA body composition scan or validated BIA assessment if you have no baseline skeletal muscle mass index on record
The framing that tends to get results: “I’m interested in establishing a baseline for muscle health and bone density as part of preventive monitoring — can we add these to my panel?” This positions the request as proactive screening rather than symptom investigation, which is accurate and tends to be better received.
What standard GP panels miss — and how to fill the gaps
The challenge is that this is exactly the kind of question a routine annual check-up was not designed to answer — not because doctors don’t care, but because population-level reference ranges were never built to account for your specific training load, body composition history, or risk profile. PTH is rarely requested unless bone disease is already suspected. Irisin is not yet in standard panels at all. A GP working within a standard appointment slot is optimising for pathology detection, not longitudinal muscle health tracking. The gap is structural, not personal. Filling it means requesting specifically, or working with a sports medicine physician or preventive health clinician who routinely orders this combination.
The One Number That Predicts More Than You Expect
Why handgrip strength is your single fastest actionable data point right now
If you do nothing else from this article, get your handgrip strength measured. Not because it is the most comprehensive number in the panel — it isn’t — but because it is the fastest, cheapest, and most immediately actionable signal available. Handgrip strength functions as a potential indicator of aging, correlating with systemic muscle quality, cardiovascular risk, and overall biological resilience in ways that far outrun its simplicity as a test. Resistance training — including weightlifting and bodyweight exercises — is established as essential for boosting both strength and muscle mass, but you cannot intelligently direct that training without knowing your baseline.
The number on the dynamometer is your starting point. Everything else in the panel adds precision and context around it. Together, they give you the full dashboard. Not the engine light. The full dashboard.
At your next GP or health screening visit, ask specifically for a 25-OH vitamin D, albumin, and CRP result alongside your standard panel — then cross-reference your handgrip strength using a dynamometer reading (many sports medicine clinics and physiotherapy practices in Singapore offer this for under $30). If your vitamin D is below 50 nmol/L or your CRP is elevated above 3 mg/L alongside any subjective strength decline, bring both numbers to your doctor and ask whether a DEXA scan to establish your baseline skeletal muscle mass index is warranted.