Your doctor said your blood pressure is ‘fine’ at 138/88 — and you left the clinic relieved. But if you have a family history of heart disease or diabetes, that number may be quietly doing damage while everyone nods and moves on. This protocol gives you the exact targets to aim for, the steps to measure correctly, and the questions to bring back to your doctor.
The problem isn’t that your doctor is wrong. It’s that the threshold they’re using — the clinical floor, the point at which medicine intervenes — was never designed to be your personal longevity target. There’s a meaningful gap between the number that triggers a prescription and the number that actually protects your arteries over decades. If you have a family history of cardiovascular disease or diabetes, that gap is where your risk lives.
Why ‘Normal’ Blood Pressure Is Not the Same as ‘Optimal’ Blood Pressure
The difference between the clinical threshold (where doctors treat) and the longevity target (where risk actually begins to rise)
Think of your arteries like a garden hose under constant pressure. At 140/90, the hose isn’t bursting — but the walls are being stressed with every pulse, slowly losing elasticity over years. By the time you feel symptoms, the damage has been accumulating for a decade. The goal of this protocol isn’t to wait until the hose starts leaking — it’s to reduce the pressure before the walls weaken.
The clinical threshold of 140/90 mmHg has been the dominant benchmark since the Joint National Committee-7 (JNC-7) established it as the treatment floor for uncomplicated hypertension — and it has remained the reference point for family medicine for over two decades. But a threshold designed to decide when to prescribe medication is not the same as the number below which cardiovascular risk stops rising. Those are two different questions, and your doctor’s reassurance is answering the first one, not the second.
An active evidence review among guideline committees has been examining whether the optimal zone sits between 130/80 and 139/89 mmHg — acknowledging that the “safe” range below 140/90 is not uniformly safe for everyone in it. If you’re health-aware and motivated to protect your future, that distinction matters enormously.
What the 2025 AHA/ACC guideline shift means for people with family history of heart disease
The 2025 AHA/ACC hypertension guideline reaffirms a move toward lower blood pressure targets while simultaneously emphasising that those targets must be personalised — not applied uniformly to every adult. This is the guideline explicitly telling the medical system what optimiser-minded adults have been demanding for years: your risk profile should determine your target, not just your raw number. The entire trajectory of hypertension guidelines over the past two decades reflects this shift — away from single-number thresholds and toward individualised, risk-stratified management.
What this means practically: if you have a parent who had a heart attack before 60, or you carry a diagnosis of prediabetes, your target should be a different conversation than the one you’d have if you were a healthy 45-year-old with no family history. The 2025 guidelines support that conversation. Most standard consultations don’t get there — not because your doctor doesn’t care, but because population-level reference ranges were never built to account for your specific risk architecture.
Step 1 — Know Your Real Number (Most Clinic Readings Are Wrong)
Why single clinic readings systematically overestimate or underestimate your true blood pressure
A single reading taken by a nurse after you’ve walked in from the carpark, rolled up your sleeve mid-conversation, and sat down for thirty seconds is measuring something — but it may not be measuring your actual blood pressure. Anxiety, recent exertion, caffeine, a full bladder, talking during the reading, an unsupported arm: every one of these variables pushes the number up. And yet this is the reading that ends up in your file as your blood pressure.
The reverse is also true. Some people consistently read normal in a clinical setting but run significantly higher at rest and at work — a pattern called masked hypertension, where your real-world blood pressure is worse than your clinic record suggests. Others run high in clinics due to anxiety but are genuinely normal at home — this is white coat hypertension. Both patterns are common. Both are invisible if you only measure in one context.
The correct home monitoring protocol — device type, timing, position, number of readings, and how to average them
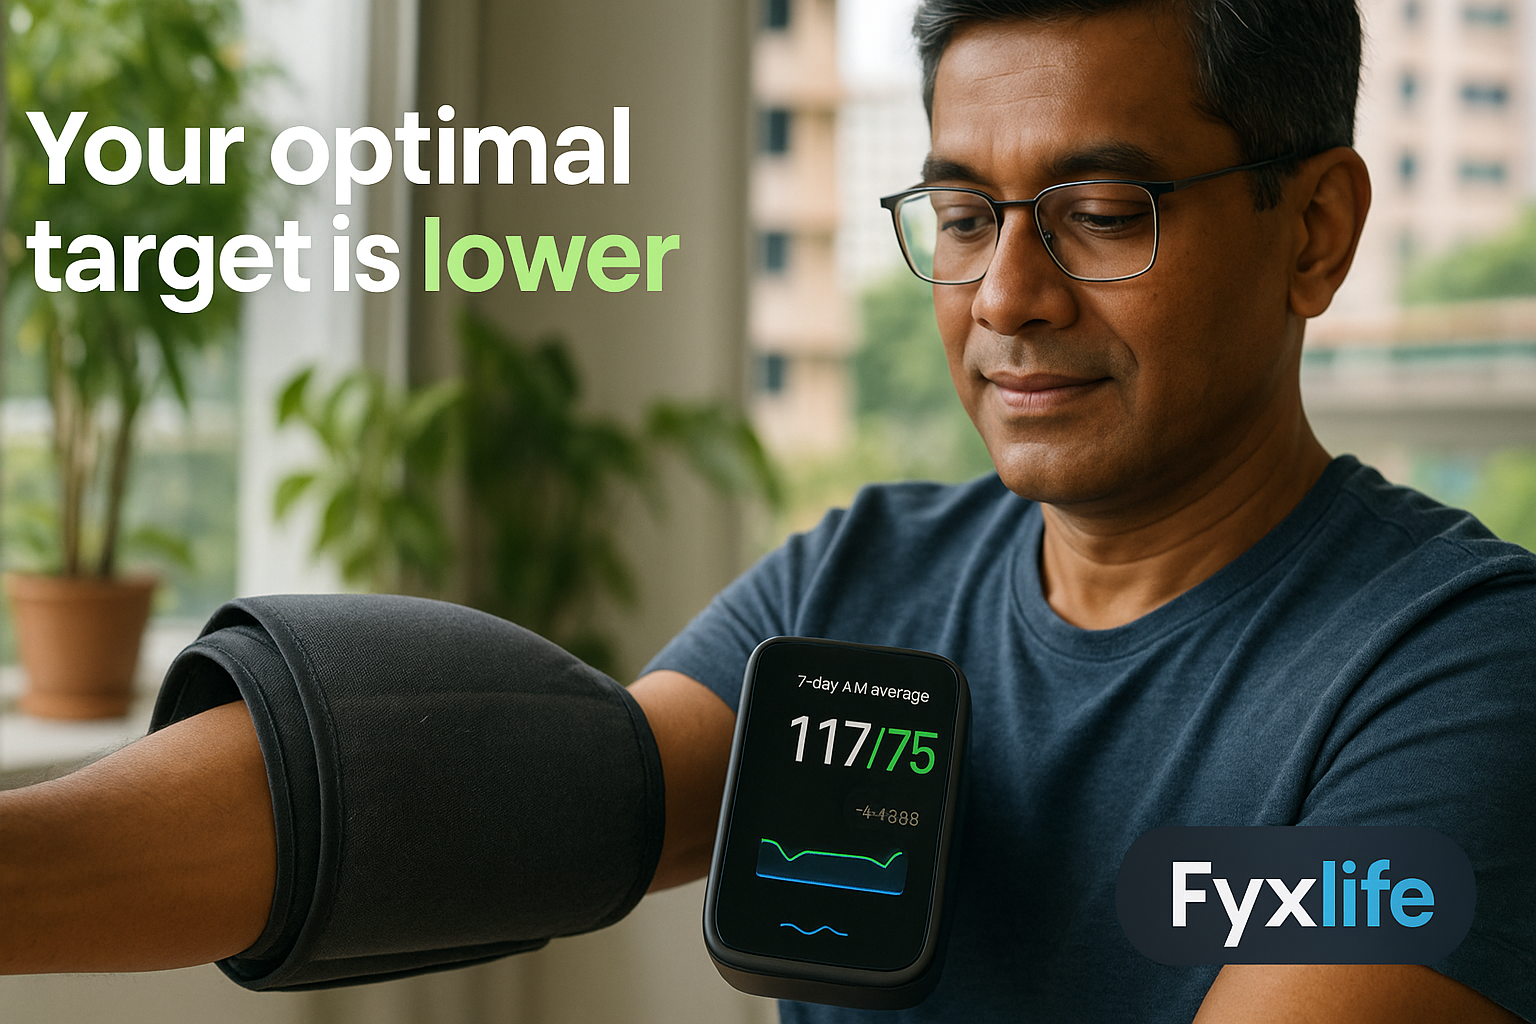
Home blood pressure monitoring is now considered a key diagnostic tool — not just a supplementary check — reflecting the 2025 guideline’s expanded emphasis on out-of-office readings. Use a validated upper-arm cuff device, not a wrist monitor. Sit in a chair with your back supported, feet flat on the floor, arm resting at heart height. Do not talk. Do not check your phone. Sit quietly for five minutes before the first reading. Take two readings two minutes apart and record both. Do this every morning before food, coffee, or medication — and every evening before dinner — for a full week. Your true blood pressure is the average of those readings, not any single number.
What ‘white coat hypertension’ and ‘masked hypertension’ mean and why both matter
White coat hypertension inflates your perceived risk and can lead to unnecessary medication. Masked hypertension understates your real risk and leaves you undertreated. Neither shows up in a single clinic measurement. If your home average is more than 10 points different from your clinic reading in either direction, that discrepancy is the first thing worth discussing with your doctor — before any target conversation begins.
Step 2 — Identify Your Target (It Depends on Your Risk Profile)
Target for healthy adults with no known risk factors
If you have no family history of cardiovascular disease, no diabetes, no existing arterial disease, and your 10-year cardiovascular risk is low, a target below 130/80 mmHg is a reasonable longevity goal. Clinical practice guidelines acknowledge that lower blood pressure targets — below the standard 140/90 threshold — may be appropriate at a practitioner’s discretion for certain individuals. Even if you sit comfortably below 140/90, there is meaningful evidence that cardiovascular risk continues to fall as systolic pressure moves from 135 toward 120.
Target for adults with diabetes — where guidelines currently diverge and what to ask your doctor
This is where the evidence gets genuinely complicated, and honest communication requires acknowledging that. The 2025 AHA/ACC guideline specifically identifies blood pressure targets for people with diabetes as an unresolved evidence gap requiring further refinement. Some analyses suggest that aggressive lowering below 130 mmHg systolic in people with diabetes may reduce cardiovascular events. Others suggest the benefit plateaus — and that in some populations, very low pressure increases risk. If you have diabetes, your target is not a number you should accept from population-level guidance alone. It is a question your doctor should be answering using your specific kidney function, duration of diabetes, and cardiovascular risk score.
Target for adults with known cardiovascular disease, arterial plaque, or prior stroke
If you already have evidence of plaque building inside your artery walls (a process called atherosclerosis) or you have had a previous cardiovascular event, the 2025 guidelines support a more aggressive systolic target — generally below 130 mmHg, and for some profiles, below 125 mmHg. The hose analogy applies with particular force here: damaged walls tolerate ongoing pressure less well than healthy ones. The case for tighter control is stronger, not weaker, once disease is established.
Target for adults over 65 — why lower is not always better
For adults over 80, blood pressure targets must be individualised around frailty, comorbidities, and life expectancy — and aggressive lowering in this group carries documented risks. Orthostatic hypotension — the sudden drop in blood pressure on standing up (which increases fall risk significantly) — becomes clinically meaningful in older adults who are medicated to aggressive targets. Between 65 and 79, the evidence still broadly supports targets below 130/80 for most people. But the conversation becomes more nuanced with age, not less. If you are managing a parent’s hypertension alongside your own, this is a critical distinction.
Step 3 — Use a Cardiovascular Risk Calculator Before Your Next Doctor Visit
What the PREVENT calculator is and how to use it
The PREVENT calculator — which stands for Predicting Risk of cardiovascular disease EVENTs — is the AHA’s current recommended tool for estimating your 10-year risk of a heart attack or stroke. It uses age, sex, blood pressure, cholesterol, blood sugar, kidney function, and smoking status to generate a personalised risk score. You can access it online, and it takes less than five minutes if you have your recent lab results available. Fill it in before your next appointment, not during it.
How your 10-year risk score should change the target your doctor sets for you
Cardiovascular risk tools like the PREVENT calculator are now recommended to help shape blood pressure targets and treatment decisions — moving beyond raw numbers toward risk-based personalisation. A 10-year risk above 10% changes the blood pressure conversation significantly. It moves you from “is this number technically normal?” to “what target do I need to hit to meaningfully reduce my risk over the next decade?” Bring your score to your appointment. Ask your doctor where it places you. If they haven’t mentioned the calculator, they may not be using it — and that gap is worth closing.
This is the kind of question a routine annual check-up was not designed to answer — not because doctors don’t care, but because a standard appointment slot was built around acute presentations, not longitudinal risk optimisation for specific patient profiles. Knowing your PREVENT score before you walk in changes what that appointment can accomplish.
Step 4 — The Lifestyle Levers That Move Blood Pressure Most (Ranked by Evidence)
Sodium reduction — what the evidence actually supports
Reducing sodium intake lowers blood pressure — but the effect size varies substantially depending on how salt-sensitive you are, a trait that has a genetic component. The average effect of reducing sodium from a typical Western intake to below 2,000 mg per day is roughly 4–5 mmHg systolic. That’s meaningful — enough to move someone from a high-normal reading into a genuinely lower risk zone. Practically, the biggest lever isn’t putting down the salt shaker. It’s processed and restaurant food, which accounts for the majority of dietary sodium in most diets in Singapore and Southeast Asia.
Exercise type and dose — what moves the needle vs what does not
Aerobic exercise — sustained moderate-intensity movement that raises your heart rate for 30 minutes or more — is the form most consistently shown to reduce blood pressure. The reduction averages 5–8 mmHg systolic with regular practice. Resistance training adds an independent benefit. Zone 2 cardio, specifically — sustained aerobic work at a conversational pace — appears to produce adaptations in the blood vessel walls (improving what researchers call endothelial function, the ability of artery linings to dilate and respond flexibly to pressure changes) that go beyond what intensity-focused training achieves. Walking briskly for 30 minutes most days is not an underperforming substitute. It is genuinely one of the most evidence-supported blood pressure interventions available.
Sleep, stress, and the autonomic nervous system connection
Chronically poor sleep and unmanaged psychological stress elevate blood pressure through a shared mechanism: persistent activation of the sympathetic branch of the body’s threat-response system (what researchers call autonomic nervous system dysregulation). This keeps the body in a mild version of the fight-or-flight state — heart rate slightly elevated, blood vessels slightly constricted — for hours at a time. Over months and years, this adds a chronic load to arterial walls that no medication fully corrects if the underlying input remains. Seven to nine hours of sleep per night and any consistent stress-reduction practice — even ten minutes of slow breathing daily — produce measurable reductions in daytime blood pressure in people with elevated readings.
What NOT to do — common self-treatment mistakes that mask real hypertension
The most common mistake is white-knuckling your readings down for a few days before a clinic visit — cutting sodium sharply, exercising the morning of the appointment, skipping alcohol — and then returning to normal habits afterward. This produces a reassuring clinic number that does not reflect your actual daily blood pressure. The second mistake is relying entirely on supplements marketed for blood pressure without confirming their effect with home monitoring. Magnesium, beetroot, and CoQ10 have some evidence behind them — but the effect sizes are modest and variable, and using them as a substitute for confirmed measurement is a form of productive-feeling inaction.
Step 5 — When to Escalate to Medication (and What to Ask)
The threshold where lifestyle alone is unlikely to be sufficient
If your home average sits consistently above 140/90 after three months of genuine, sustained lifestyle modification — improved sleep, consistent exercise, meaningful sodium reduction — the evidence base for lifestyle-only management at that level is thin. The evidence comparing a systolic target of 140 mmHg versus 130 mmHg was assessed as low quality in one evidence review, derived from a relatively small study — meaning even the 140 threshold carries meaningful uncertainty. If you are above it consistently at home, medication is not a failure. It is the appropriate next step, and delaying it while the arterial walls continue to absorb pressure is the actual risk.
Questions to ask your doctor about medication targets vs lifestyle-only management
Go in with specific questions rather than leaving the target to be set by default. Ask what home average would trigger a prescription recommendation for someone with your risk profile. Ask whether the target changes if your PREVENT score is above 10%. Ask whether the goal is below 130 systolic or below 140 — and ask why. These questions are not confrontational. They are the difference between receiving population-level management and receiving care calibrated to you.
Your Blood Pressure Monitoring Log — What to Track and How to Read It
The one-week morning measurement protocol
Every morning for seven consecutive days: same arm, same chair, five minutes of seated stillness before the first reading, two readings two minutes apart, both recorded. Add the evening readings if you can. Date every entry. Write down anything that might affect the reading — a poor night’s sleep, a stressful morning, coffee taken before you remembered not to. At the end of seven days, calculate your average systolic and average diastolic separately. That average is more informative than any single clinic measurement you have ever had taken.
What patterns in your log should trigger a doctor conversation
Watch for three patterns. First: a consistent morning average above 130/80, even if individual readings dip lower. Second: a significant difference between your morning and evening readings — more than 10 mmHg systolic — which can indicate blood pressure variability linked to autonomic dysregulation or medication timing. Third: a home average that sits more than 10 points lower than your most recent clinic reading, which would confirm white coat hypertension and potentially mean you are being treated more aggressively than your real-world blood pressure requires. Any of these patterns warrants a direct conversation, not a wait-and-see approach.
This week, take your blood pressure at home every morning for seven consecutive days — same arm, seated and still for five minutes beforehand, two readings two minutes apart — then average the results. Bring that log to your next doctor visit and ask: ‘Given my family history and this home average, what is the right target for me — not just the standard threshold?’ That one question changes the entire conversation.