Your doctor says your blood pressure is ‘fine’ at 138/88 — but if you have a family history of heart disease or diabetes, that number is not fine. The threshold your clinic uses to trigger treatment is not the same as the target that protects your long-term health, and that gap is where cardiovascular damage quietly accumulates.
This is not an argument against your doctor. It is an argument for understanding the difference between two distinct things: the number that prompts a prescription, and the number that keeps your arteries healthy over the next twenty years. For most people sitting in a standard appointment, those two numbers are never separated. For you — with your specific risk profile — that distinction may be the most important cardiovascular conversation you are not having.
Why 140/90 Is a Treatment Trigger, Not a Safety Certificate
The number your doctor uses to prescribe medication is not the number that protects your arteries over 20 years
Think of your blood pressure target like a car’s tyre pressure rating. The tyre won’t blow out immediately at 36 PSI instead of the recommended 32 — but run it that way for five years and the wear is cumulative, invisible, and one day structural. The treatment threshold of 140/90 mmHg is the number at which your doctor will tell you the tyre is dangerously overinflated. Your longevity target — below 130/80 mmHg — is the pressure at which the tyre lasts as long as it was engineered to.
The Joint National Committee-7 Report recommended blood pressure targets of below 140/90 mmHg for people with uncomplicated hypertension — a threshold still widely used in clinical settings today. That number was designed as a population-level prescription trigger, not a precision longevity target. The fact that it remains the default number your clinic uses is a function of how health systems work, not of what the more recent evidence says about cardiovascular protection.
The 2025 AHA/ACC multisociety guideline sets the first objective of treatment as lowering blood pressure to below 140/90 mmHg in all patients, with a secondary push toward below 130/80 mmHg for most individuals with established cardiovascular risk. That secondary target is the one most motivated health optimisers should be paying attention to — and the one least likely to come up in a ten-minute appointment.
How cardiovascular risk rises continuously — not in a sudden jump at a threshold
Here is the critical reframe. Blood pressure risk does not work like a light switch. It does not turn off at 139/89 and on at 140/90. A study on continuous risk assessment confirms that cardiovascular risk rises incrementally with each millimetre of mercury above 115 systolic — making the ‘normal’ label at 138 genuinely misleading for high-risk adults. The word ‘normal’ describes where most of the population sits. It does not describe where you want to be.
This matters because ‘borderline’ reassurance — “it’s a little high but not concerning” — is often given to people in the 130–139 / 80–89 range who carry the exact risk factors that make that range worth taking seriously. Emphasis on reaching discrete blood pressure targets should not detract from reducing overall predicted cardiovascular risk — blood pressure is one variable in a continuous risk equation, not a binary pass/fail marker.
Your Personal Target: How to Set the Right Number for Your Risk Profile
No family history of CVD, no diabetes, age under 60 — what target applies
If you carry no significant cardiovascular risk factors and you are under sixty, the current evidence supports aiming for below 130/80 mmHg as an optimal target — not a clinical emergency threshold. This is where the tyre pressure analogy does its real work: you are not waiting for the blowout signal. You are maintaining the pressure that extends the life of the tyre.
Family history of heart disease or stroke — why below 130/80 mmHg is the more defensible goal
Clinical evidence defines ‘lower targets’ as blood pressure at or below 135/85 mmHg and ‘standard targets’ as below 140/90 mmHg, with evidence showing benefit for lower targets specifically in high-risk populations. If your father had a heart attack at 58 or your mother had a stroke in her sixties, you are by definition a high-risk adult. The 140/90 threshold was not built with your family history in mind. Below 130/80 is the more defensible goal — not aggressive, not extreme, just evidence-calibrated for someone in your position.
Diabetes and hypertension together — how guidelines individualise the target
The combination of diabetes and high blood pressure is where the single-number approach breaks down most visibly. The ADA and the ACC/AHA have published diverging recommendations on individualising blood pressure targets for people with both diabetes and hypertension, underscoring that no single number applies universally to this population. If you have both conditions, your target is not a fixed number you can look up — it is a calculation that requires someone examining your specific kidney function, cardiovascular history, and medication interactions. The challenge is that this is exactly the kind of question a routine annual check-up was not designed to answer — not because doctors don’t care, but because population-level reference ranges were never built to account for your specific risk combination.
Age over 60 — why aggressive lowering can carry its own risk and how to navigate it
Above sixty, the picture shifts. A clinical review on optimal blood pressure targets with age recommends that clinicians discuss individualised targets with patients, acknowledging that a systolic target of 120–130 mmHg may be appropriate for older adults in certain contexts — but not all. Overly aggressive lowering in older adults, particularly those on multiple medications, can reduce blood flow to the brain and increase fall risk. The goal is still below 140/90 as a floor, with individualised judgement about whether pushing toward 130/80 is appropriate for your specific profile. The 2025 AHA/ACC guideline explicitly frames blood pressure targets as requiring individualisation based on age, comorbidities, and cardiovascular history — meaning no one number applies, and age is one of the key variables.
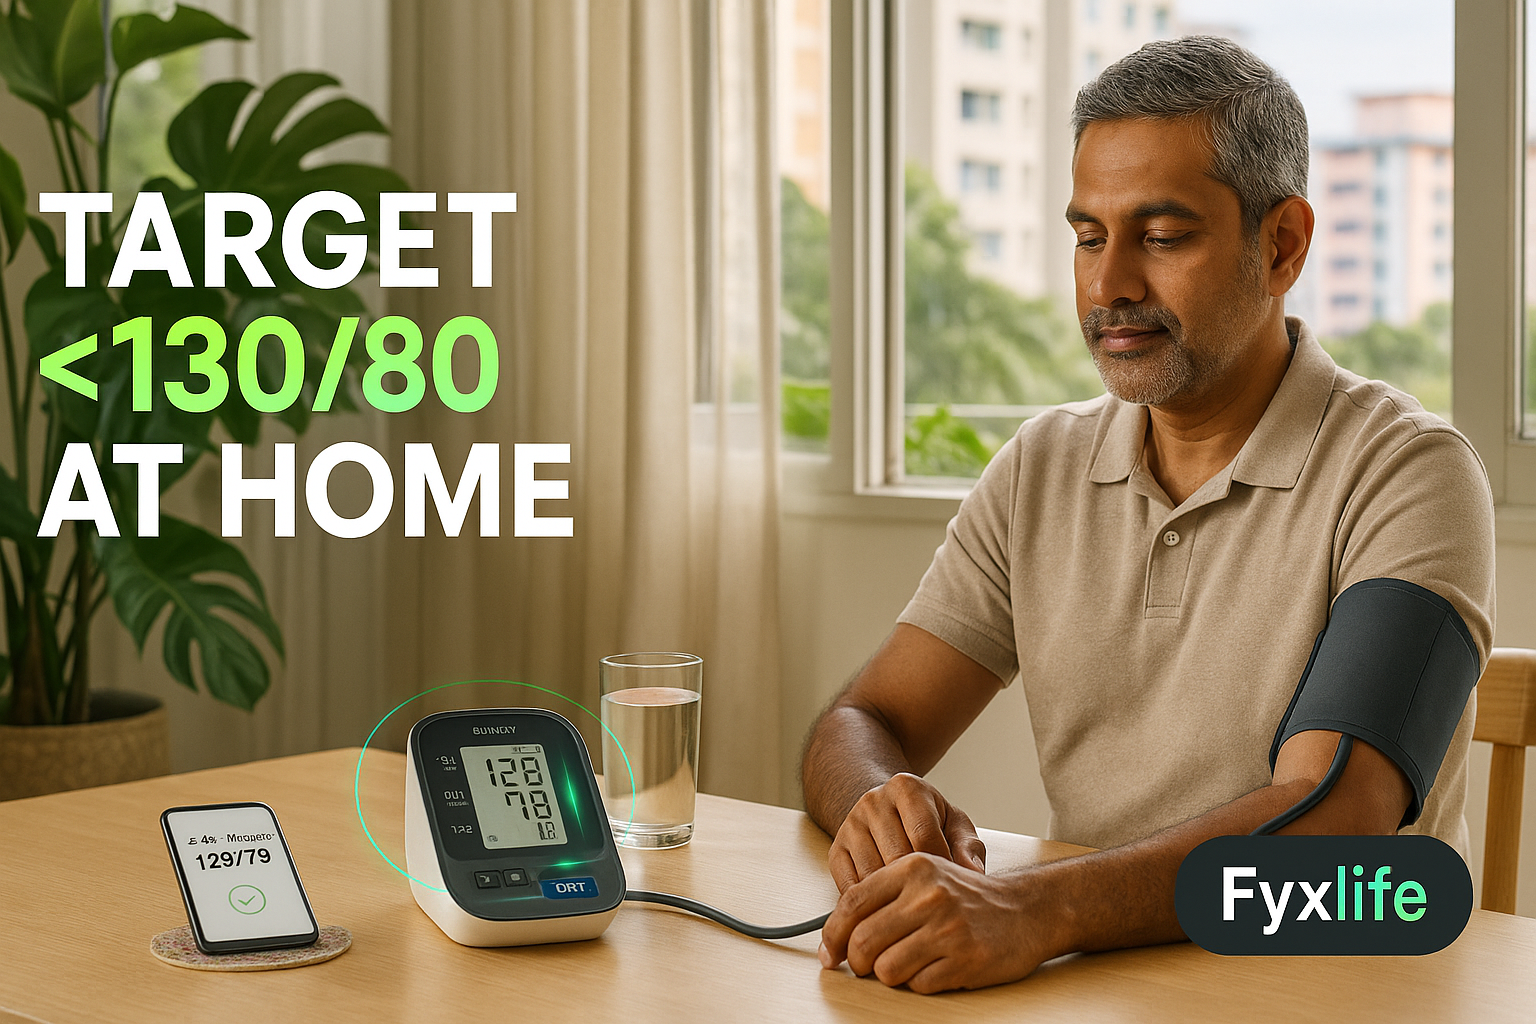
The Home Measurement Protocol (Step-by-Step)
Step 1 — Equipment: which cuff type is validated and why wrist monitors mislead
Use an upper-arm cuff monitor validated by a recognised body such as the British Hypertension Society or the American Medical Association. Wrist monitors are convenient but notoriously inaccurate — small changes in wrist angle alter the reading significantly, and the vessels at the wrist are narrower, producing systemic measurement error. The investment in a validated upper-arm device is the foundation everything else depends on. Expect to spend around SGD 80–150 for a reliable model.
Step 2 — Conditions: the five rules before you press start
No coffee or caffeine for at least thirty minutes before measuring. No exercise for at least thirty minutes prior. Sit quietly for five full minutes before taking the reading — not the time it takes to wrap the cuff, but five minutes of genuine rest. Use your non-dominant arm unless instructed otherwise. Keep your back supported against a chair, feet flat on the floor, and arm resting at heart level on a table. The white-coat effect — where anxiety in a clinical setting temporarily elevates blood pressure — combined with incorrect cuff size and arm position can cause a single clinic reading to misrepresent your true average by 10 to 15 mmHg. Every one of these five conditions addresses a specific source of that error.
Step 3 — Timing: morning before medication, evening before bed — why both readings matter
Take readings twice daily: once in the morning before any medication and before coffee, and once in the evening before bed. Morning readings capture your baseline. Evening readings reveal whether your pressure is being controlled throughout the day or only at the point your medication peaks. The gap between the two is itself informative. A consistent pattern of high evening readings with normal mornings, or the reverse, is worth bringing to a doctor as a data point, not just a single number.
Step 4 — Recording: take three readings, discard the first, average the last two
At each sitting, take three consecutive readings with a one-minute gap between each. Discard the first reading — it is almost always elevated by the act of measuring itself. Average the second and third. This is the number you record. A single-reading protocol is not a protocol. It is a guess.
Step 5 — Duration: seven consecutive days to establish a reliable baseline
Seven consecutive days of morning and evening readings, averaged across the full period, gives you what clinicians call your home blood pressure average — the most reliable single indicator of your true resting blood pressure. Relying on single readings, post-exercise measurements, or pharmacy cuffs — without a structured home monitoring plan — is one of the most common errors in self-assessed blood pressure management. Seven days removes outliers, captures daily variation, and gives you something worth showing a doctor.
What to Do With Your Numbers
How to interpret your 7-day average against your personal target
Once you have your seven-day average, compare it against the right target for your risk profile — not the generic 140/90 clinical threshold, but the personalised target established in the section above. Below 120/80 with no symptoms: well-controlled, maintain and monitor quarterly. Between 120–129 / 80–84: within the healthy zone, but worth watching trends. Between 130–139 / 80–89 with any cardiovascular or metabolic risk factor: this is the zone that deserves active management, not reassurance. Above 140/90: this warrants a doctor conversation regardless of your risk profile.
When to act with lifestyle first — and the non-negotiable lifestyle levers with evidence behind them
If your average sits in the 130–139 range, lifestyle intervention has genuine and substantial evidence behind it — not as an alternative to medication if medication is warranted, but as a first-line tool with measurable results. The interventions with the strongest evidence are sodium reduction (targeting below 2,000 mg daily), regular aerobic exercise (150 minutes per week of moderate intensity), weight reduction if applicable, limiting alcohol to no more than one standard drink per day, and the DASH dietary pattern (a diet high in vegetables, fruits, whole grains, and low-fat dairy, low in saturated fat and sodium) which has consistent evidence for systolic reductions of 8–14 mmHg. A systematic review examining optimal blood pressure targets provides the evidence base underpinning the shift toward tighter targets — and lifestyle modification remains the first tool for those in the elevated but pre-medicated range.
When to escalate to your doctor and what to bring to that conversation
Escalate when your seven-day average exceeds 140/90, when you carry significant risk factors and your average is consistently above 130/80 despite three months of lifestyle intervention, or when you notice a meaningful upward trend over consecutive quarterly measurements. What you bring matters as much as when you go. Arrive with your seven-day log, the time of day each reading was taken, your current medications, and a specific question about your personalised target — not a request for general advice, but a direct question about the right number for your specific risk profile.
What NOT to Do (The Protocol Killers)
Do not rely on a single clinic reading to declare yourself ‘fine’
A single reading taken by a nurse in a busy clinic, after you walked from the car park and sat for ninety seconds, is not your blood pressure. It is a data point with significant noise. The clinical evidence is explicit: a single clinic reading can misrepresent your true average by 10 to 15 mmHg due to white-coat effect, cuff positioning, and measurement conditions alone. A reading of 135/85 under those conditions might reflect a true resting pressure of 122/78 — or 148/92. You cannot know from one number.
Do not ignore readings in the 130–139 / 80–89 range if you carry metabolic or cardiovascular risk
NICE evidence review found that the evidence comparing systolic targets of 140 mmHg to 130 mmHg was low quality, from only one relatively small study — which means the push to lower targets is directionally supported but not yet settled science for all populations. What that does not mean is that 138/88 is safe for someone with a diabetic parent and a family history of stroke. Directional evidence is still evidence. The 130–139 range with risk factors is not a place to park and feel reassured.
Do not treat home monitoring as optional if you have a family history
Hypertension treatment guidelines now recommend moving away from a universal number toward a risk-stratified framework that accounts for age, comorbidity, and baseline cardiovascular risk. That framework only works if you have actual data. A single annual clinic reading fed into a risk calculator is not a cardiovascular monitoring plan. It is a snapshot taken once a year in the worst possible measurement conditions. Home monitoring is not a nice-to-have for high-risk adults. It is the protocol.
Tracking Over Time — The One Number to Watch Each Quarter
How to spot a trend before it becomes a diagnosis
Do a full seven-day home measurement protocol once per quarter — not daily obsession, which creates its own anxiety and measurement noise, but a structured quarterly audit. Track your seven-day systolic average in a simple spreadsheet or notes app. A rise of five mmHg across two consecutive quarters is a signal worth investigating before it reaches the threshold that prompts a prescription. The goal is to catch the tyre wearing, not to wait for the warning light.
The biomarkers to pair with blood pressure for a complete cardiovascular picture
Blood pressure does not tell the whole story. The markers that give it context are fasting glucose and HbA1c (a measure of your average blood sugar over three months, which reveals insulin stress on the vascular system), lipid panel with apolipoprotein B (the particle count that better predicts arterial plaque risk than total cholesterol alone), high-sensitivity CRP (a marker of low-grade inflammation in the arteries), and resting heart rate. Together, these variables paint a cardiovascular picture that blood pressure alone cannot. A systolic average of 128 mmHg means something different alongside a fasting glucose of 6.8 mmol/L and a high-sensitivity CRP of 3.2 mg/L than it does alongside clean metabolic markers. The clinical case for individualised targets — accounting for the full biomarker picture alongside blood pressure — is now well-established in the literature, even if it is not yet standard in the ten-minute appointment.
This week, take your blood pressure at home on three consecutive mornings — before coffee, before medication, after five minutes seated quietly — and record the average. If your systolic average sits above 130 mmHg and you carry any cardiovascular risk factor (family history, diabetes, overweight, or age over 50), bring that 3-day log to your next doctor visit and ask specifically: ‘Given my risk profile, should my personal target be below 130/80, not just below 140/90?’