
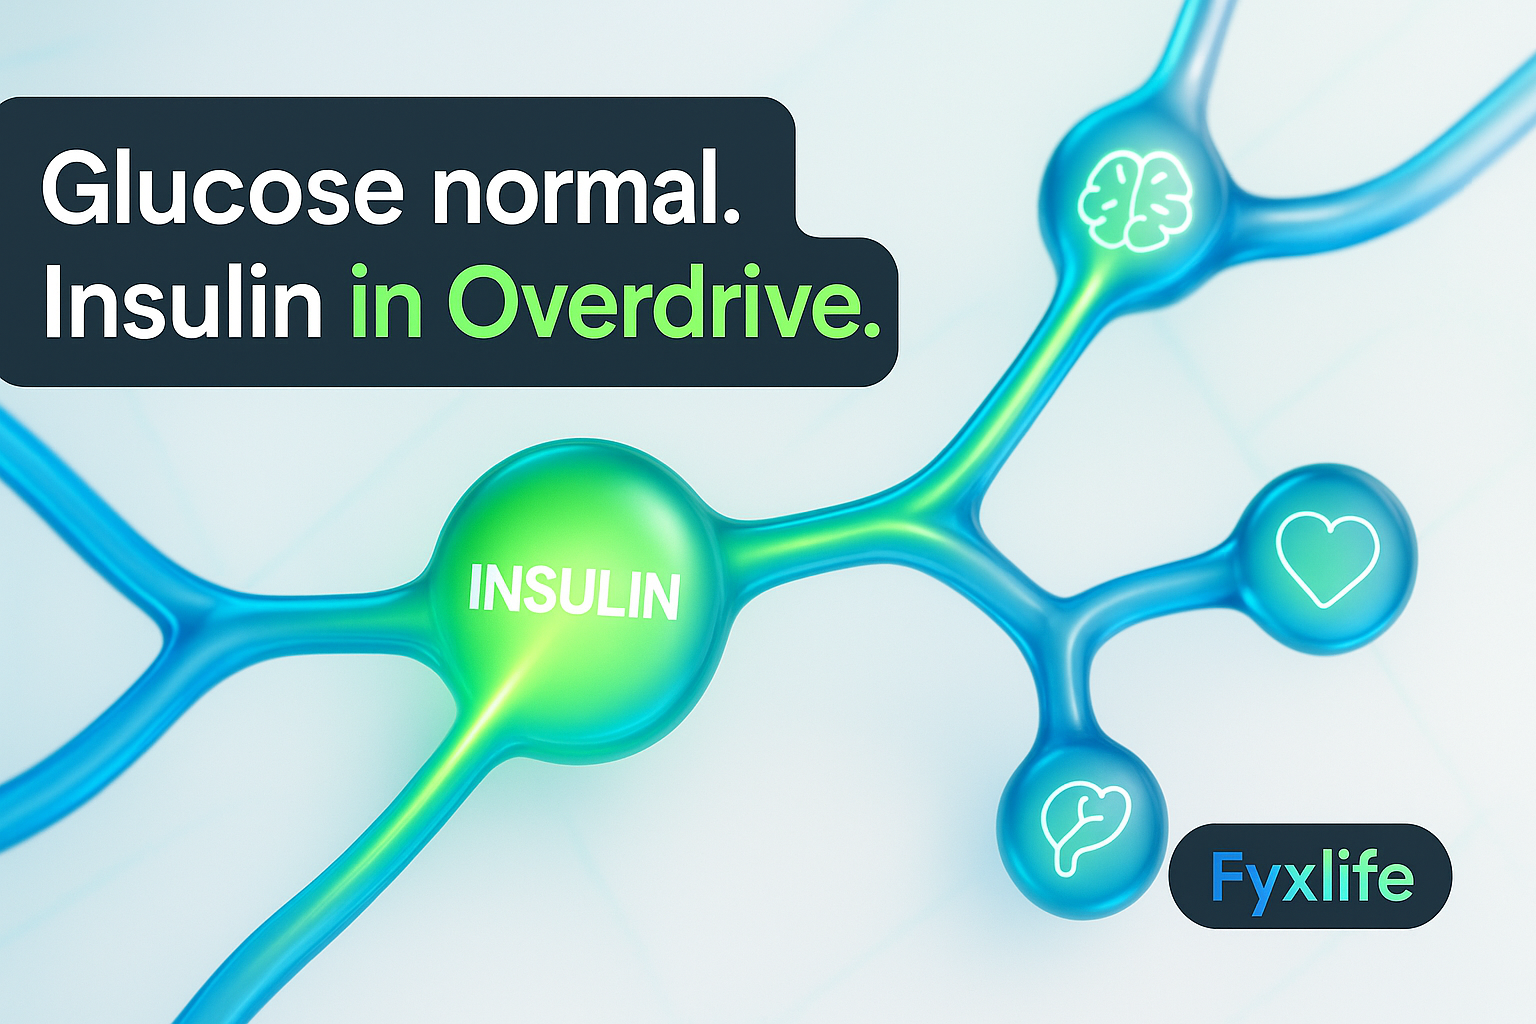
You got your annual blood test back. Glucose: normal. HbA1c: fine. Doctor says you’re good. But you’re gaining weight around your middle, your energy crashes after meals, and something still feels off. What your results didn’t show is that your pancreas may have been working five times harder than it should — and that silent overwork is already triggering a chain reaction across your heart, liver, and brain.
This is not a story about diabetes. It’s a story about what happens in the decade before diabetes — when every standard marker looks reassuring and the actual problem is invisible to the tests being run. Understanding it requires looking one step upstream of where medicine typically looks.
The Test Your Doctor Probably Did Not Order
Why Fasting Glucose Passes While Insulin Fails Silently
Your fasting glucose measures one thing: how much sugar is circulating in your blood after an overnight fast. What it cannot tell you is how hard your body had to work to produce that number. A perfectly normal glucose reading of 4.8 mmol/L looks identical whether your pancreas produced a modest, appropriate amount of insulin to achieve it — or whether it produced five times that amount, straining to compensate for cells that have stopped listening.
This is the fundamental gap. The compensation mechanism works so effectively in the early stages that glucose stays normal for years while insulin climbs silently. By the time your fasting glucose finally tips into the abnormal range, the underlying dysfunction has typically been building for a decade. You passed the test. The test was measuring the wrong thing.
What Fasting Insulin Actually Measures — And Why It Changes First
Fasting insulin — the level of insulin circulating in your blood after you haven’t eaten for at least eight hours — is a direct readout of your body’s baseline regulatory workload. During a true fasted state, healthy insulin secretion drops to a low baseline, allowing counter-regulatory hormones to coordinate energy release from the liver and fat stores. When fasting insulin is elevated, it means this baseline system has broken down. Your pancreas is running at elevated output even when there’s nothing to process. That is the earliest detectable signal in the cascade — and it’s a signal that a standard panel never captures, because fasting insulin is simply not part of it.
The Root Cause: When Energy Storage Systems Are Pushed Too Hard
How Insulin Resistance Arises From Chronic Energy Surplus
Think of your body’s insulin system like a bouncer at a nightclub door. Early on, if the crowd is too big, the bouncer just works harder — pushing people through faster. From the outside, the queue — your blood glucose — looks fine. But the bouncer is exhausted, the club is dangerously overcrowded with your cells overwhelmed by fat and glucose, and the building’s fire exits — your liver, your arteries, your pancreas — are quietly under strain. The crisis doesn’t show up at the door until the bouncer collapses. By then, three other systems are already on fire.
Insulin resistance arises when the nutrient storage pathways evolved to maximise efficient energy utilisation are exposed to chronic energy surplus — meaning this is a system pushed beyond its design limits, not a sudden failure. It is the predictable outcome of asking a finely tuned biological mechanism to handle a load it was never built for, consistently, over years.
The Compensation Loop: More Insulin, Less Effect, More Insulin Still
When your cells begin to ignore insulin’s signal, the pancreas does the logical thing: it produces more. The primary insulin signalling route that controls glucose uptake into cells — a pathway researchers call PI3K/PDK1/AKT2 — becomes progressively blunted, and the pancreas compensates with higher and higher output before any glucose abnormality ever appears on a standard test. This is the compensation loop. More insulin achieves the same glucose clearance, temporarily. But the elevated insulin itself is now doing damage — independent of glucose — across every organ system that insulin touches. Which is most of them.
Cascade Step 1 — Your Liver Gets Overwhelmed
How Elevated Insulin Switches the Liver Into Fat-Storage Mode
The liver is the first organ downstream of the portal circulation — meaning it receives the highest concentration of insulin of any organ in the body. Under normal conditions, insulin signals the liver to store some glucose and pause fat release. Under chronically elevated insulin, this signal gets stuck in the on position. In the liver, insulin activates fat-making gene expression — the process researchers call lipogenesis — and decreases the genes that control glucose production, meaning elevated insulin directly instructs the liver to make and store more fat. The liver was not designed to be a long-term fat depot. When it fills up, the fat spills into the bloodstream as triglycerides, and the metabolic consequences begin to compound.
The Early Warning Signs of Fat Accumulation Around Organs
Insulin regulates fat metabolism through the insulin signalling cascade, while fat metabolites can also directly feed back to worsen insulin sensitivity — creating a self-reinforcing loop that accelerates the cascade rather than stabilising it. The fat accumulating inside and around the liver — what a scan would call fatty liver, or what researchers term hepatic steatosis — is not merely cosmetic. It actively worsens the insulin resistance that caused it, tightening the loop. The waist circumference you have been watching expand is partially a surface expression of this process playing out deeper, around your organs.
Cascade Step 2 — Your Heart and Blood Vessels Pay the Price
How Insulin Resistance Drives High Blood Pressure and Abnormal Cholesterol Simultaneously
Cardiovascular risk is usually discussed as if high blood pressure and abnormal cholesterol are separate problems requiring separate explanations. In many cases, they share the same root. The metabolic consequences of insulin resistance include chronically elevated blood sugar, high blood pressure, abnormal blood fats — what clinicians call dyslipidaemia — elevated uric acid, and elevated inflammatory markers, all arising from a single upstream dysfunction. When the liver is exporting excess triglycerides into the bloodstream, when the kidneys are retaining sodium under insulin’s influence, and when arterial walls are losing their flexibility in response to chronically elevated insulin, you are not facing multiple independent problems. You are facing one problem with multiple faces.
Elevated Inflammatory Markers: The Chemical Alarm Signals No One Tracked
Alongside the lipid and blood pressure changes, the insulin-resistant state generates what researchers describe as low-grade systemic inflammation — a chain reaction of damage-signalling molecules throughout the body (what researchers call systemic inflammation). Markers like high-sensitivity C-reactive protein, or hs-CRP, and interleukin-6 begin to rise, quietly. These are chemical alarm signals indicating that the vascular environment has become hostile. Plaque quietly building inside artery walls — atherosclerosis — progresses faster in this environment. The tragedy is that none of these markers are part of a standard annual check-up for someone who has not yet been diagnosed with anything. And this is precisely the kind of question a routine annual check-up was not designed to answer — not because doctors don’t care, but because population-level reference ranges were never built to account for where you sit within this cascade.
Cascade Step 3 — Your Pancreas Starts to Fail
From Overwork to Exhaustion — How Beta Cells Break Down
The pancreatic beta cells — the specialised cells responsible for manufacturing and secreting insulin — are not infinitely resilient. They are doing extraordinary compensatory work during the years when your glucose looked normal. Chronic overnutrition or persistently elevated insulin — what researchers call hyperinsulinaemia — eventually drives beta cell dysfunction, as the cells producing insulin begin to fail under sustained demand. This is not a sudden collapse. It is a slow exhaustion. Output peaks, then begins to decline. The compensation that kept your glucose normal for years becomes biologically unsustainable.
The Point Where ‘Normal’ Blood Sugar Finally Breaks
When beta cell output can no longer compensate for the degree of insulin resistance, glucose levels begin to climb. First into the range clinicians call impaired fasting glucose or pre-diabetes. Then, eventually, into the range that earns a type 2 diabetes diagnosis. At this point, the standard panel finally catches the problem — the glucose number has broken. But the problem itself is a decade old. The liver has been accumulating fat. The arteries have been silently thickening. The inflammatory environment has been active. What registers as a new diagnosis has been a cascade in progress since long before anyone ran the right test.
How to Find Where You Are In the Cascade
The Test Panel That Catches This Early: Fasting Insulin Plus Fasting Glucose
Metabolic syndrome — the cluster of central obesity, insulin resistance, high blood pressure, and abnormal blood fats — is a collection of cardiometabolic risk factors sharing a common root in insulin resistance. But you do not need to have metabolic syndrome to benefit from testing. You need to test early enough to find out where you are before the cluster forms. The tool for this is straightforward: a simultaneous fasting insulin and fasting glucose draw, from the same blood sample, at the same appointment. Fasting insulin alone tells you how hard the pancreas is working. Fasting glucose tells you whether the compensation is still holding. Together, they let you calculate a measure called HOMA-IR — short for Homeostatic Model Assessment of Insulin Resistance — which quantifies your degree of insulin resistance from those two numbers alone.
How to Read the Numbers — And What to Ask Your Doctor Next
A fasting insulin level above roughly 8 to 10 mIU/L — even with completely normal glucose — warrants a closer look. Some functional medicine practitioners use a tighter optimal range of 3 to 6 mIU/L for people actively trying to stay ahead of this cascade. The standard reference range on most lab reports, however, is set wide enough to capture the full population, which means a result of 15 mIU/L might be flagged as normal when it is telling a very different story in context. When you receive your results, the question to ask is not whether your insulin is within the lab’s reference range. The question is whether it is where it should be for someone who wants to prevent the cascade described above — and that is a conversation requiring someone who will look at your specific numbers, your glucose together with your insulin, and calculate what your HOMA-IR actually means for you.
The One Upstream Variable Worth Tracking First
Of all the metabolic variables you could chase — triglycerides, blood pressure, liver enzymes, inflammatory markers — fasting insulin is the one that moves earliest. It is the signal at the top of the cascade, before the downstream damage has accumulated enough to show up anywhere else. The bouncer is exhausted long before the building catches fire. Testing fasting insulin alongside fasting glucose gives you a window into a process that standard medicine currently waits years to see. That window is narrow. It is also when the lever is most effective.
Before your next blood test, ask your doctor to add fasting insulin to the standard fasting glucose draw. If your fasting glucose is in the normal range but your fasting insulin comes back elevated — even slightly above the lower optimal threshold — that single data point tells you the cascade has begun upstream of what any standard panel would catch, and gives you and your doctor a specific, early lever to act on.