The Verdict Up Front — Is Advanced Insulin Resistance Testing Worth It?
Your last blood test came back normal — fasting glucose fine, cholesterol acceptable, doctor satisfied. But if insulin resistance has been quietly building for years, standard tests may have completely missed it. Here is what the evidence says about whether advanced insulin resistance testing is worth pursuing before your body gives you a harder signal.
The short answer is yes — with conditions. If you are 40 or older, have a family history of heart disease, diabetes, or cancer, carry any weight around your midsection, or simply want your real metabolic picture rather than a population-averaged reassurance, the evidence supports going further than a standard annual panel. Not because testing is automatically useful, but because the diseases downstream of insulin resistance — cardiovascular disease, cognitive decline, and certain cancers — are precisely the ones that kill quietly and early in this region. The window where intervention works best is the same window standard testing is most likely to miss.
What We Mean by ‘Advanced Testing’ (vs. Your Standard Annual Blood Panel)
Your standard annual blood panel in Singapore typically includes fasting glucose, HbA1c (a measure of your average blood sugar over the past three months), a basic lipid panel showing total cholesterol, LDL, HDL, and triglycerides, and a metabolic panel covering liver and kidney function. These are good tests. They are just not designed to catch insulin resistance early. Advanced testing, in this context, means adding fasting insulin, calculating your resistance score from two numbers, and in some cases ordering a lipid panel that goes beyond total LDL to examine particle size and density. None of these tests are exotic. Most are available at private labs in Singapore. The barrier is not access — it is that almost no one thinks to ask.
Why Standard Tests Miss the Problem
The Gap Between ‘Normal’ Glucose and Real Metabolic Health
Think of insulin resistance like a jammed lock on every cell in your body. Insulin is the key, and glucose is the delivery truck trying to drop off fuel. When the lock jams, the truck circles the block endlessly — glucose stays in the bloodstream, insulin levels spike to force the door, and the entire neighbourhood (your cardiovascular system, brain, liver, and hormonal balance) gets disrupted by the traffic jam. The damage does not start when you are diagnosed with diabetes. It starts years earlier, while your fasting glucose still looks perfectly normal on a standard test.
This is the core problem. Fasting glucose and even HbA1c can appear entirely normal while insulin resistance is already driving systemic damage — because your pancreas is compensating. It is pumping out more and more insulin to force glucose into resistant cells, successfully keeping blood sugar in the normal range. The glucose number looks fine. The insulin number — which nobody measured — is quietly elevated. The reassurance your doctor gave you may have been based on incomplete information, not incomplete care.
What Insulin Resistance Is Actually Doing While Your Results Look Fine
Insulin resistance primarily impairs biological response in three target tissues: the liver, muscle, and fat tissue — meaning its effects are systemic from the very beginning, not localised to your pancreas or blood sugar regulation. In the liver, it drives excess glucose production and fat accumulation. In muscle, it reduces the uptake of glucose that should be fuelling your energy. In fat tissue, it increases the release of free fatty acids into the bloodstream. Each of these disruptions feeds back on the others. The cascade of metabolic dysfunction begins silently, long before any clinical diagnosis.
There is also an age dimension that most people do not know about. In adults with normal glucose tolerance, fasting insulin levels and insulin resistance both increase in parallel with aging — meaning if you are between 40 and 65 and reading this, your trajectory is already heading toward impaired metabolic function even if every number on your last panel was green. This is not alarmism. It is biology. The question is how far along that trajectory you are, and whether you know it.
The Disease Cascade — What Is at Stake If You Miss It Early
Heart Disease: The Arterial Pipeline Gets Clogged Upstream
The cardiovascular consequences of insulin resistance are mechanistic, not merely associative — meaning insulin resistance connects to heart disease through multiple direct biological pathways, not just as a statistical correlation in large studies. Emerging evidence shows that the risk of developing cardiovascular disease increases with both aging and prolonged insulin resistance, independent of the conventional lipid markers your doctor is already watching. Put differently: you can have a normal LDL and still be accumulating cardiovascular risk driven by insulin resistance that your standard panel is not measuring.
Brain Health: Why Some Researchers Call Alzheimer’s ‘Type 3 Diabetes’
The brain is one of the most insulin-sensitive organs in the body. When cellular insulin signalling breaks down, neurons lose their ability to efficiently use glucose for fuel — the same traffic jam that disrupts your cardiovascular system plays out in your brain tissue over years and decades. Insulin resistance plays a crucial role in the development and progression of a range of metabolic and degenerative diseases, and the research linking it to Alzheimer’s risk is sufficiently robust that some neurologists now refer to Alzheimer’s informally as type 3 diabetes. Insulin resistance has been associated with a 23% higher risk of Alzheimer’s disease — a figure that reframes metabolic health as a brain health issue, not just a cardiovascular one.
Cancer Risk: The Least-Talked-About Downstream Consequence
This is the connection most people have not heard, and it deserves direct attention. Insulin resistance has been linked to 12 types of cancer, with uterine cancer showing the strongest association at a 134% increased risk. The mechanism involves chronically elevated insulin acting as a growth signal — insulin and its related growth factors promote cell proliferation, and persistently high levels create an environment where abnormal cells are more likely to survive and divide. This does not mean insulin resistance causes cancer in any simple or deterministic sense. It means that if oncology prevention is part of your health strategy, your metabolic status is part of the conversation. Most cancer prevention conversations in Singapore do not yet include it.
The Tests — What the Evidence Actually Supports
Fasting Insulin: The Simplest Upgrade Most Doctors Do Not Order
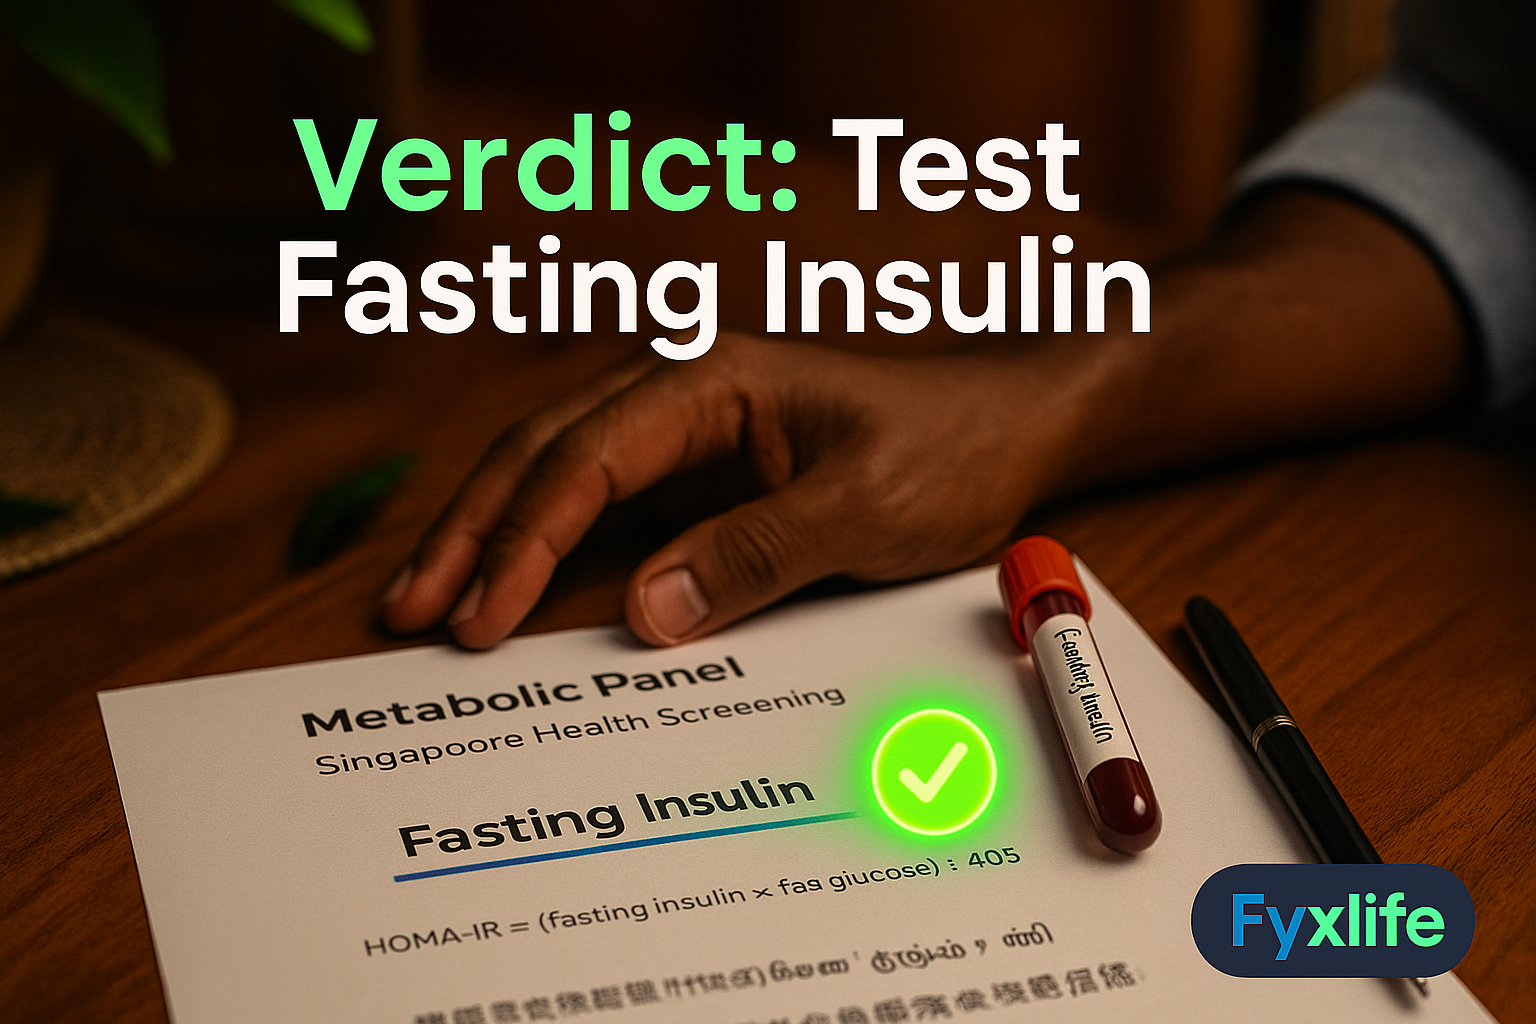
Fasting insulin is exactly what it sounds like: a blood draw after an overnight fast that measures how much insulin your pancreas is producing to keep your glucose in range. A high fasting insulin with a normal fasting glucose is the biochemical fingerprint of early insulin resistance — the compensating pancreas working overtime before it eventually starts to fail. This single test costs roughly the same as a standard lipid panel at most private labs in Singapore. It is not ordered on standard health screening packages. You have to ask for it specifically.
HOMA-IR: Calculating Your Resistance Score From Two Numbers
HOMA-IR (the Homeostatic Model Assessment for Insulin Resistance) is a calculated score derived from your fasting insulin and fasting glucose. The formula combines these two numbers to estimate how resistant your cells are to insulin’s signalling. A HOMA-IR below 1.0 suggests high insulin sensitivity. Scores between 1.0 and 1.9 indicate the early stages of resistance. Above 1.9, most metabolic clinicians consider insulin resistance clinically meaningful — even if your glucose is still normal. The value of HOMA-IR is that it gives you a single actionable number from data you can get at any lab, without any additional testing infrastructure.
Advanced Lipid Panels: Reading the LDL Particle Fingerprint
Standard lipid panels measure total LDL cholesterol — the total amount of the particle, not its character. But not all LDL is equal. A shift toward small, dense LDL particles combined with reduced large HDL correlates with insulin resistance in large cohort studies — and this pattern is detectable on advanced lipid panels that measure particle size and number rather than just total cholesterol weight. Small, dense LDL particles are more likely to penetrate arterial walls and contribute to the fatty plaque buildup inside arteries (atherosclerosis) that precedes heart attacks and strokes. If your standard LDL looks fine but you have insulin resistance, your particle profile may tell a very different story.
Oral Glucose Tolerance Test With Insulin: The Gold Standard Most Avoid
The most complete picture of your insulin response comes from an oral glucose tolerance test with simultaneous insulin measurements — you drink a standardised glucose solution, then have blood drawn at 30, 60, and 120-minute intervals to track both glucose and insulin curves. This test captures something no fasting measurement can: how aggressively your insulin spikes in response to a glucose load, and how quickly it clears. An exaggerated insulin spike followed by a delayed glucose clearance is a meaningful early warning sign. The test is more time-consuming than a standard blood draw and not universally available, but for anyone with a strong family history of metabolic disease, it is the most granular picture available outside a research setting.
What the Evidence Does NOT Support
Supplements Marketed as Insulin Sensitisers — The Short-Term Study Problem
The longevity supplement market has produced an extensive category of products marketed as insulin sensitisers — berberine, chromium, alpha-lipoic acid, cinnamon extract, and others. Some of these have plausible mechanisms. The evidence, however, does not yet support their use as primary interventions. Nutrient supplements showed statistically significant improvement in HbA1c only in short-term interventions under 12 weeks, with dosage having no impact on outcomes — suggesting that whatever effect these compounds produce does not scale with dose and does not persist over time. This is not a reason to dismiss them entirely, but it is a reason to be sceptical of aggressive supplement regimens marketed as metabolic protection. The lifestyle interventions — resistance training, dietary carbohydrate quality, sleep, stress load — have substantially stronger and more durable evidence.
Wearable CGM for Non-Diabetics — Signal vs. Noise
Continuous glucose monitors (CGMs) — small sensors worn on the upper arm that track blood glucose in real time — have become increasingly popular among health optimisers in Singapore and the region. They are genuinely useful for understanding how specific meals and activities affect your glucose response. The caution is this: in people without diabetes, CGM data produces a large volume of glucose fluctuation information that is difficult to interpret without a clinical framework. Post-meal glucose spikes that look alarming on a CGM app may fall within normal physiological range. The deeper problem — elevated fasting insulin, resistant tissue at the cellular level — is not visible on a CGM at all. It is a useful tool in the right hands with the right context. As a standalone test for insulin resistance, it measures the symptom rather than the cause.
Asian and Singapore-Specific Context — Why Your Risk Threshold Is Lower
Metabolic Risk at Lower BMI: Why Standard Cutoffs Do Not Apply Here
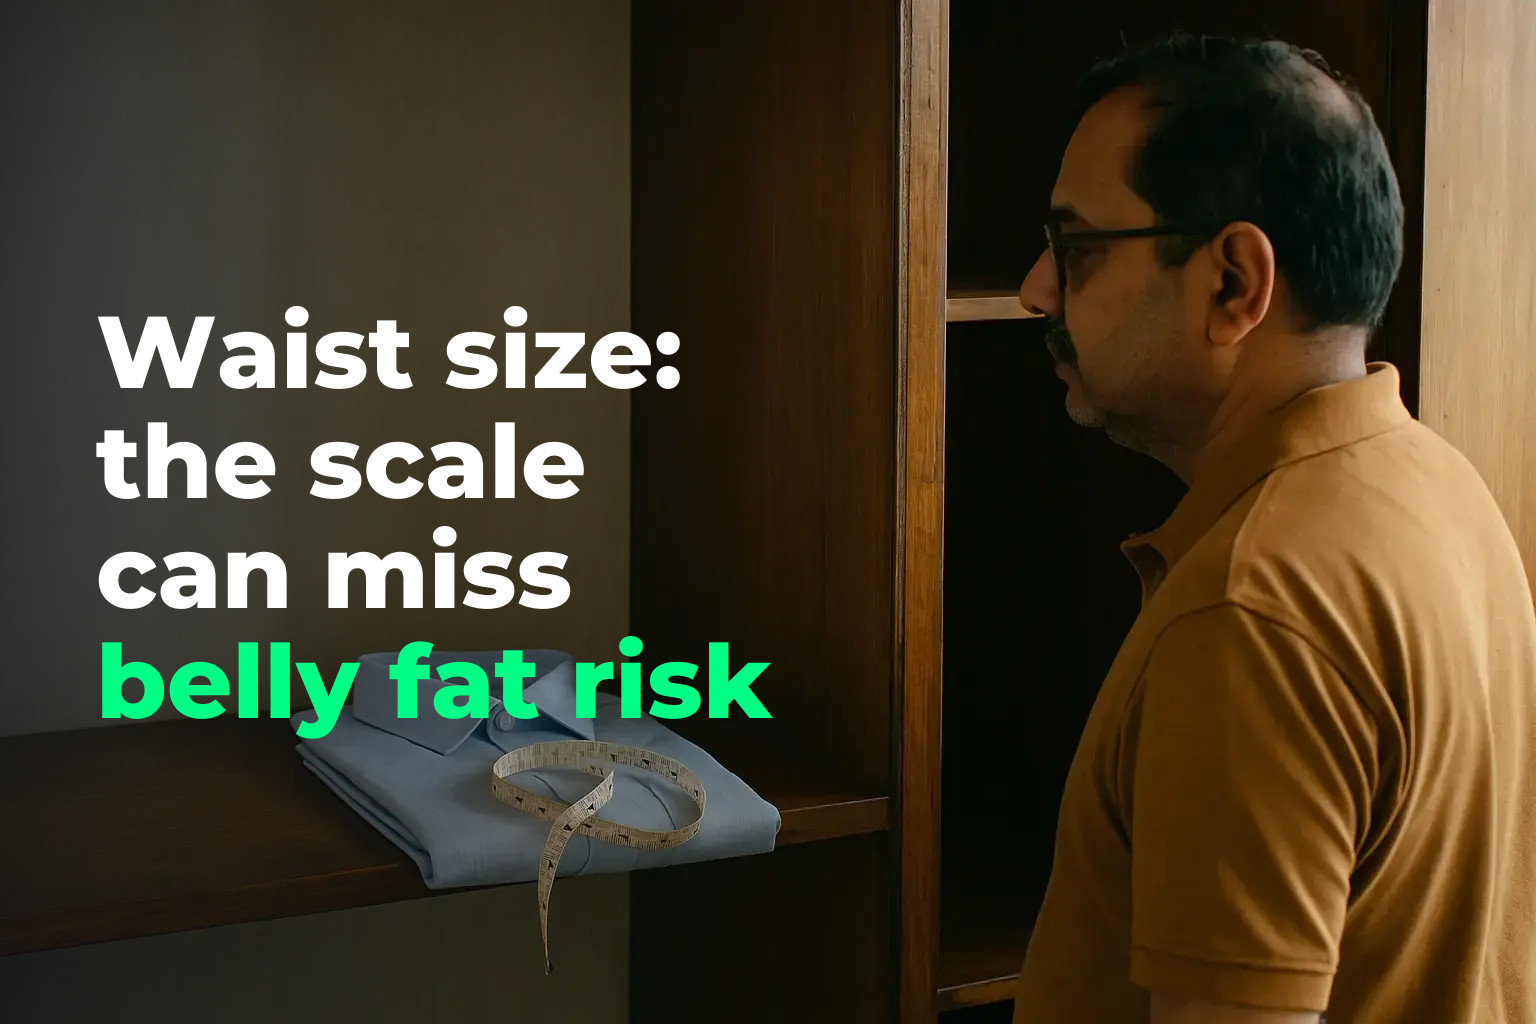
The standard BMI cutoffs for overweight (25) and obesity (30) were derived primarily from studies in European populations. For East and Southeast Asian populations, metabolic risk — including insulin resistance, type 2 diabetes, and cardiovascular disease — begins at meaningfully lower body weights. In Singapore, the Ministry of Health’s own guidelines acknowledge this: overweight in Asian adults begins at a BMI of 23, and obesity at 27.5. This matters for insulin resistance testing because many Singaporeans and Southeast Asians who would not be flagged as at-risk by Western BMI standards are already carrying visceral fat (the fat stored deep around internal organs, rather than under the skin) at levels that drive insulin resistance. You can have a completely unremarkable BMI, a flat-looking abdomen, and still have significant metabolic dysfunction driven by visceral adiposity. The standard reassurance — “your weight is fine” — does not account for this.
This is exactly the kind of question a routine annual check-up was not designed to answer — not because doctors do not care, but because population-level reference ranges and ten-minute appointment slots were never built to account for your specific ethnic risk profile, family history, and the combination of markers that together tell a meaningful story.
Decades of research have established that insulin resistance contributes to a wide range of metabolic and degenerative diseases, with some researchers now asking whether it may be the central driver — the hidden architect — of aging itself. Whether or not that framing holds, the practical implication for someone in Singapore at 45 with a parent who had a heart attack is clear: the standard testing framework was not built for your risk profile.
Final Verdict — Who Should Test, What to Order, and When It Is Overkill
Advanced insulin resistance testing is worth pursuing if you are 40 or older with a family history of type 2 diabetes, cardiovascular disease, or any of the cancers associated with metabolic dysfunction; if you are carrying weight around the abdomen regardless of your overall BMI; if your triglycerides are elevated or your HDL is low even with a normal total cholesterol; or if you simply want an accurate metabolic baseline rather than an absence-of-obvious-disease clearance. For this group, adding fasting insulin to your next panel is the minimum useful upgrade, and calculating HOMA-IR gives you something actionable from two numbers you will already have.
It is overkill if you are in your early thirties, lean, active, with no family history and no metabolic symptoms — the prior probability of meaningful early insulin resistance is low enough that advanced testing adds more anxiety than information. The oral glucose tolerance test with insulin measurements is justified for anyone with a meaningful family history or an already-elevated HOMA-IR who wants a complete picture before deciding on an intervention strategy. An advanced lipid panel with particle sizing is warranted if your HOMA-IR is elevated or your standard triglyceride-to-HDL ratio (a rough proxy for insulin resistance) is above 3.0.
Insulin resistance is not a diabetes problem — it is a whole-body disease cascade that is detectable years before it becomes diagnosable, and intervenable at precisely the stage when intervention is most effective. The test panel that catches it early is not complicated. It is just not the one most people are currently requesting.
At your next blood test — or before you book one — ask your doctor specifically to add fasting insulin to the standard panel. If you already have a recent fasting glucose result, you can calculate your HOMA-IR score yourself (fasting insulin × fasting glucose ÷ 405 using mg/dL units). A HOMA-IR above 1.9 is considered early insulin resistance by many metabolic clinicians. If your result sits in that range, bring it to your doctor and ask whether an advanced lipid panel with LDL particle sizing is warranted. This one number — fasting insulin — is the single most actionable upgrade most health-conscious adults in Singapore are not yet requesting.