
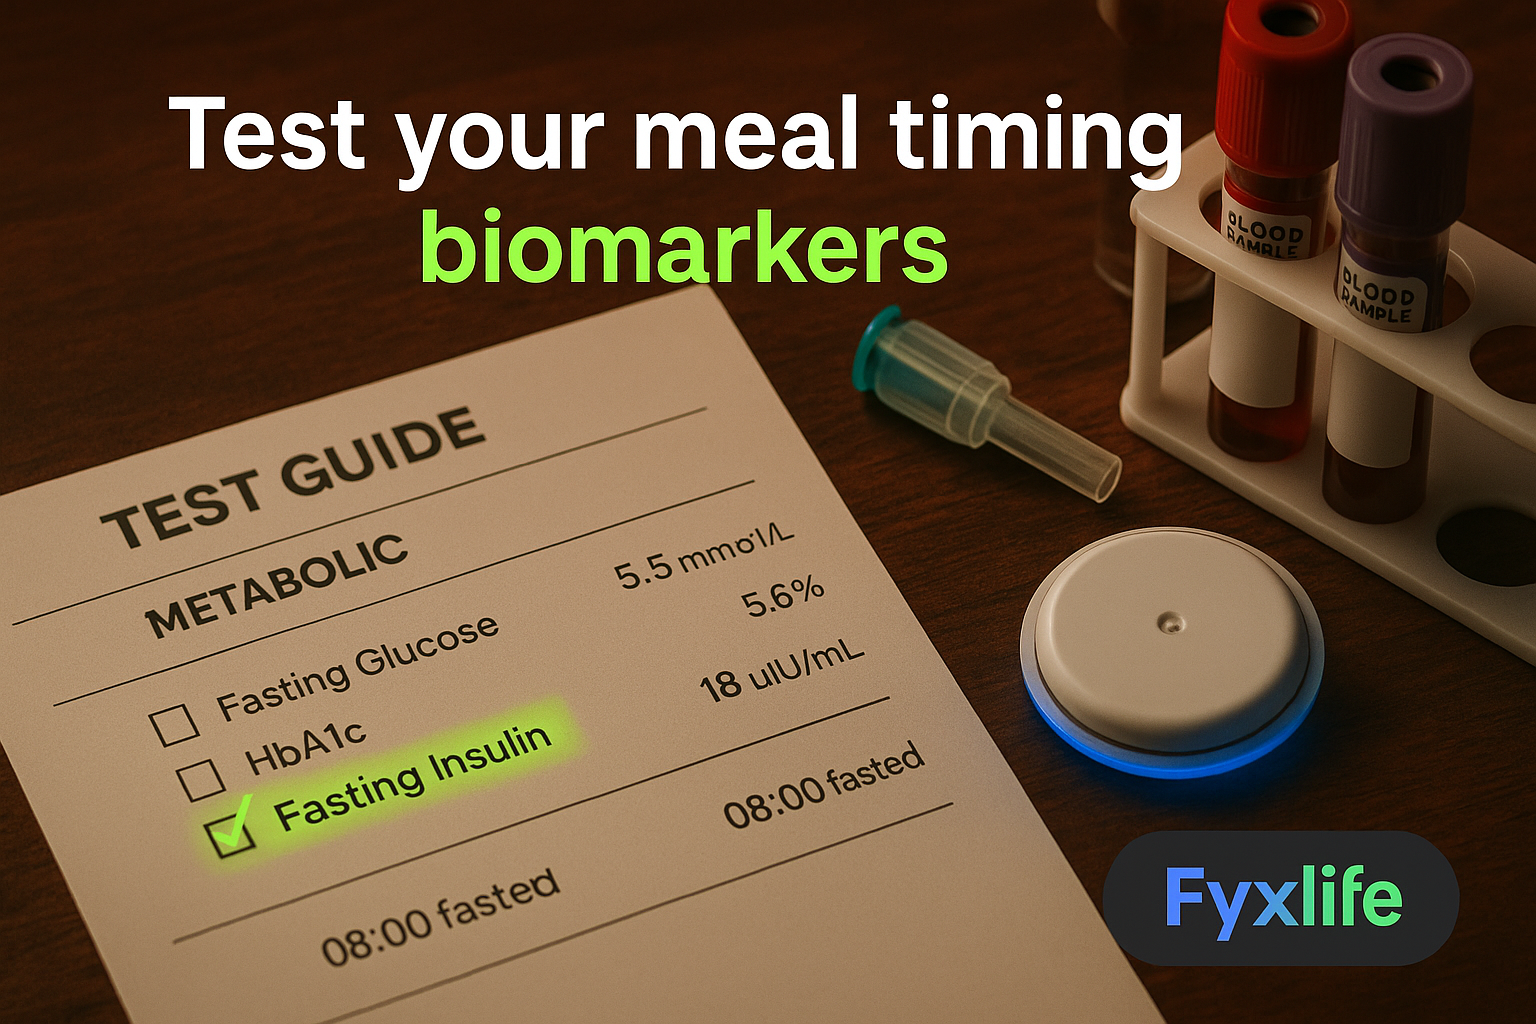
You eat reasonably well, but something still feels off — energy crashes after lunch, the scale won’t budge, or your blood sugar swings more than it should. Before you overhaul your diet again, consider that the problem may not be what you’re eating, but when. This guide tells you exactly which biomarkers to test, how often, and what the results actually mean for your meal timing strategy.
Most nutrition troubleshooting starts and ends with the contents of your plate. Macros, food quality, portion sizes — these are real levers, and they matter. But they don’t account for the growing body of research showing that the timing of your meals operates as an independent variable in metabolic health. Two people eating identical diets can produce meaningfully different metabolic outcomes based solely on when they eat. If your current testing framework doesn’t account for that, you may be optimising the wrong thing.
Why Meal Timing Needs Its Own Testing Framework
The difference between testing what you eat versus when you eat
Standard metabolic testing — fasting glucose, cholesterol, HbA1c — was designed to catch disease, not to optimise the timing of a healthy body’s daily rhythms. When your doctor reads your results against population-level reference ranges, they’re asking: “Is this person sick?” That’s a different question from: “Is this person’s metabolism running on schedule?” The biomarkers overlap, but the interpretation framework doesn’t.
Testing what you eat requires tracking nutrients. Testing when you eat requires tracking patterns — specifically, whether your body’s internal 24-hour clock (the technical term is your circadian rhythm) is synchronised with the times you’re asking it to do metabolic work. Chrononutrition research — the science of how meal timing interacts with your body clock to affect metabolism and weight — treats eating windows, meal frequency, and the timing of your largest meal as distinct variables worth measuring independently from what those meals contain.
What circadian-metabolic misalignment actually looks like on a test result
Think of your metabolism like a restaurant kitchen. It runs best when deliveries arrive at predictable times — ingredients stored efficiently, nothing wasted, everything prepared on schedule. When food arrives at random hours — especially late at night — the kitchen scrambles, stores things in the wrong places (fat around your organs), and the morning shift starts in chaos. Your biomarkers are the inspection report that tells you whether your kitchen is running on schedule or constantly playing catch-up.
On a test result, circadian-metabolic misalignment (the state where your eating patterns are out of sync with your body clock’s expected schedule) tends to show up not as dramatic abnormalities, but as a cluster of borderline findings: fasting glucose that’s edging toward the higher end of normal, triglycerides that seem high given your overall diet quality, or HbA1c that’s crept up despite no obvious dietary explanation. Each marker in isolation might not flag anything. Together, they tell a different story.
The Core Biomarkers to Test
Fasting glucose and fasting insulin — your baseline metabolic signal
Fasting glucose measures the concentration of sugar in your bloodstream after an overnight fast — the kitchen’s baseline inventory check at the start of the morning shift. It tells you whether your body cleared the previous day’s fuel load efficiently. What it doesn’t tell you is how hard your body worked to achieve that number. That’s where fasting insulin becomes essential. Insulin is the hormone your pancreas secretes to drive glucose into your cells. If your fasting glucose looks acceptable but your fasting insulin is elevated, your body is working overtime to maintain that number — a state called insulin resistance, where cells have become less responsive to insulin’s signal. This combination is one of the clearest biomarker signals that meal timing intervention is worth considering.
Research on chrono-nutritional profiles has specifically identified eating window and the timing of the largest meal as variables associated with weight loss outcomes — and fasting insulin is the marker most sensitive to those changes. Fasting glucose is your starting point. Fasting insulin is what gives it context.
HbA1c — the 90-day average that reveals pattern, not just a single meal
HbA1c (glycated haemoglobin, or the percentage of your red blood cells that have glucose molecules attached to them) gives you a three-month rolling average of blood sugar control. A single fasting glucose can be manipulated by what you ate the day before. HbA1c cannot. It reflects your sustained pattern. Studies examining the distribution of energy intake across the day — not just total calories — have found metabolic differences that standard annual testing would pick up in HbA1c over time. If you change your meal timing protocol and retest HbA1c twelve weeks later, a meaningful shift in that number tells you the intervention worked at a systemic level.
Fasting triglycerides — a sensitive marker of late-night and irregular eating
Fasting triglycerides are the fats circulating in your bloodstream after an overnight fast. They’re particularly responsive to the timing and composition of your last meal, and to irregular eating patterns. Late-night eating drives triglyceride elevation because the body’s fat-clearance machinery — like the kitchen’s cleaning crew — operates on a schedule. Ask it to process a large delivery at midnight and efficiency drops sharply. Research into chrono-nutritional profiles has linked eating window length and meal timing to weight loss outcomes, with fasting triglycerides among the more sensitive short-term markers of change. If your triglycerides are consistently above 1.5 mmol/L despite a diet that doesn’t obviously explain it, late or irregular eating is a plausible contributing factor worth investigating.
Cortisol (morning) — your body clock’s master switch
Morning cortisol is the stress hormone that your body releases in a natural surge within 30 to 45 minutes of waking (called the cortisol awakening response). It’s not just a stress signal — it’s one of the primary mechanisms by which your body clock activates metabolism, raises alertness, and signals to peripheral organs that the day has begun. A healthy morning cortisol spike is metabolically useful. A blunted or delayed spike suggests your circadian system is shifted — meaning your body may not be primed for metabolic activity at the time you’re eating breakfast. Understanding how meal timing and circadian rhythm cooperate makes morning cortisol a meaningful anchor point: if your cortisol rhythm is shifted late, eating early may feel unnatural — and may also explain why early time-restricted eating works well for some people and feels counterproductive for others.
Optional: lipid panel and hsCRP for metabolic inflammation context
A full lipid panel (total cholesterol, LDL, HDL, and triglycerides measured together) provides broader context for cardiovascular and metabolic risk. More specifically for meal timing purposes, hsCRP — high-sensitivity C-reactive protein, a blood marker for low-grade systemic inflammation — can indicate whether irregular eating patterns are contributing to a chronic inflammatory state. It’s not a primary meal-timing marker, but it completes the picture when other markers are borderline and you’re trying to understand whether pattern changes are having a downstream anti-inflammatory effect.
When to Test and How Often
Baseline test: before you change anything
The most common testing mistake is retesting too soon after starting a new protocol, or testing after you’ve already changed multiple variables simultaneously. Before you shift your eating window, change meal frequency, or experiment with earlier dinners, get a baseline panel that includes fasting glucose, fasting insulin, HbA1c, fasting triglycerides, and morning cortisol. This is your kitchen inspection report before the renovation. Without it, you have no way to know what changed, or why.
Retest window: how long to run a new meal timing protocol before expecting measurable change
HbA1c requires a minimum of 90 days before a retest is meaningful — it reflects the lifespan of red blood cells, not last week’s eating. Fasting insulin and triglycerides can show directional change in as little as four to six weeks on a consistent protocol, making them useful interim markers. Cortisol rhythm requires consistency of sleep and wake times for several weeks before stabilising. A practical retest window for a meaningful meal timing intervention is twelve weeks — long enough for HbA1c to reflect the change, and long enough to know you’ve given the protocol a genuine test rather than a trial.
Frequency guide by biomarker — what needs quarterly vs annual review
Fasting glucose and HbA1c are appropriate for annual testing in healthy adults with no elevated risk — or every six months if you’re actively managing borderline results. Fasting insulin is not included in standard annual panels in most healthcare systems, which is a meaningful gap given its sensitivity to eating pattern changes; requesting it quarterly during active protocol testing is reasonable. Fasting triglycerides respond quickly enough to dietary pattern changes to be worth testing every three to four months if you’re making deliberate timing adjustments. Morning cortisol, measured via a serum blood draw taken within 60 minutes of waking, is useful as a one-off assessment when you suspect circadian disruption, and worth repeating after sustained lifestyle changes rather than on a rigid schedule.
How to Interpret Your Results in the Context of Meal Timing
What elevated fasting glucose suggests about your eating window
Fasting glucose above 5.6 mmol/L — even if technically within the “normal” range your lab report marks — warrants attention when combined with symptoms like post-lunch energy crashes or difficulty losing weight despite reasonable caloric intake. In the context of meal timing, persistently elevated fasting glucose often reflects the previous evening’s eating pattern more than the previous morning’s. Research has found that longer overnight fasting combined with an earlier breakfast was associated with lower BMI — pointing to measurable metabolic benefit from front-loading energy earlier in the day. If your fasting glucose is creeping up, extending your overnight fast and pushing breakfast earlier is a testable hypothesis, not just a wellness trend.
What high fasting triglycerides reveal about late eating behaviour
Fasting triglycerides above 1.7 mmol/L in someone who otherwise eats carefully is a signal worth taking seriously. The circadian distribution of energy intake — specifically how much of your total caloric load lands in the evening hours — has been studied as an independent driver of triglyceride elevation. If your triglycerides remain high despite reducing dietary fat and refined carbohydrates, the question to ask is not what you’re eating for dinner but when you’re finishing eating. The kitchen can’t clear fat from the bloodstream efficiently when the cleaning crew has already clocked off.
Reading cortisol rhythm: is your body clock shifted or broken?
A morning cortisol result that is low relative to reference ranges (typically below 300–400 nmol/L at 8am) can indicate either chronic stress burnout (where the adrenal system is depleted), a late chronotype (where your body clock naturally runs later than social schedules allow), or significant circadian disruption from irregular sleep or shift work. In meal timing terms, a shifted cortisol awakening response means your metabolic activation is happening later than your clock says it should. This can explain why early time-restricted eating — eating your first meal within an hour of waking — feels physically difficult for some people. It’s not necessarily willpower. It may be that your kitchen’s morning shift doesn’t start until 10am.
The pattern that suggests chrononutrition intervention is worth trying
The clearest signal that meal timing is a primary lever — rather than a marginal one — is this combination: fasting glucose in the upper-normal range, fasting insulin elevated above 8 mIU/L, fasting triglycerides above 1.5 mmol/L, and subjective symptoms of post-lunch energy crash and poor morning energy. Research has associated chrono-nutritional profiles including eating window, meal frequency, and timing of the largest meal with weight loss outcomes — and this biomarker cluster is the measurable form of what that research describes. You don’t need all four markers to be abnormal. Two or three, alongside consistent symptoms, is sufficient reason to run a structured meal timing experiment and retest in twelve weeks.
What to Track Alongside Blood Tests
Subjective energy log: morning, post-lunch, and evening ratings
Blood tests capture metabolic state at a single moment. Your daily energy pattern captures something different — the functional lived experience of whether your circadian-metabolic system is working. A simple daily log rating your energy on a scale of 1 to 10 at three fixed points (on waking, at 2pm, and at 8pm) takes under thirty seconds and generates twelve weeks of pattern data that gives your biomarker results real context. Meal patterns and timing have been associated with cognitive health outcomes in adulthood, which means your focus and mood are legitimate signals alongside physical energy — not just anecdote. If your 2pm crash disappears four weeks into a new eating window without your bloods having been retested yet, that’s directional evidence the intervention is working.
Eating window consistency — how to record it without obsessing
The most useful metric to track is not your eating window length on any given day, but its consistency across the week. An eating window of 10am to 7pm that holds seven days out of seven produces a different circadian signal than a window that shifts by three hours on weekends. You don’t need an app. Note the time of your first calorie (including coffee with milk) and your last calorie each day in any format — a phone note, a spreadsheet, a paper journal. After four weeks, calculate your average window start and end time, and more importantly, your average window variation. High variation is itself a metabolic signal. Understanding how meal timing and circadian rhythm cooperate can help optimise daily routines for better metabolic outcomes — and consistency of timing is as important as the window length itself.
Sleep quality as a co-variable you cannot ignore
Sleep and circadian rhythm are not separate systems — they are the same system expressed differently. If your sleep onset time varies by more than 60 minutes across a week, your cortisol awakening response will shift, your insulin sensitivity the following morning will be reduced, and your appetite-regulating hormones (specifically ghrelin, which drives hunger, and leptin, which signals satiety) will be dysregulated before you’ve eaten a single meal. Any meal timing experiment run on inconsistent sleep produces uninterpretable results. Track your sleep onset and wake time alongside your eating window. If sleep quality is poor and inconsistent, address that first — it is upstream of every metabolic marker this guide covers.
What to Ask Your Doctor
The specific tests to request and how to frame the conversation
In Singapore and across Southeast Asia, standard annual health screening typically includes fasting glucose, a lipid panel, and occasionally HbA1c. Fasting insulin is not a routine inclusion — you will almost certainly need to request it specifically. Frame the request practically: “I’d like to include fasting insulin alongside my fasting glucose and HbA1c this time — I’m trying to understand whether my blood sugar control is being maintained efficiently or whether it’s being compensated for.” Morning cortisol requires a separate blood draw taken as early as possible after waking, specifically before 9am — ask whether this can be combined with your fasting draw on the same morning. hsCRP is increasingly available as an add-on to standard panels and worth including if you have any borderline cardiovascular markers.
- Fasting glucose — standard, request confirmation it’s included
- Fasting insulin — not standard, request explicitly
- HbA1c — often available, confirm it’s on the panel
- Fasting triglycerides — part of a full lipid panel, confirm full panel rather than total cholesterol only
- Morning cortisol (serum, drawn before 9am) — request separately
- hsCRP — optional add-on for inflammation context
Asian-specific metabolic risk: why lower BMI does not mean lower risk in Singapore and Southeast Asia
This matters more in this region than most. Asian populations — including Chinese, Malay, and Indian ethnic groups predominant in Singapore and Southeast Asia — tend to develop insulin resistance, type 2 diabetes, and cardiovascular disease at lower body weight and lower BMI thresholds than Western reference ranges assume. A BMI of 23 in a Southeast Asian individual carries the same metabolic risk as a BMI closer to 27 in a European individual. The standard “normal” ranges on your lab report were often derived from Western population datasets. Your fasting insulin may be flagged as within-range by a lab that considers 10–12 mIU/L acceptable — but at that level, meaningful insulin resistance is likely already present. Push for interpretation against Asian-specific thresholds, not default population ranges.
The challenge is that this is exactly the kind of question a routine annual check-up was not designed to answer — not because doctors don’t care, but because population-level reference ranges were never built to account for your specific ethnic risk profile, your chronotype, or the interaction between when you eat and how your individual circadian system responds. Getting a genuinely personalised interpretation requires someone who is looking at your specific numbers in full context.
When results are ‘normal’ but symptoms persist — what to push for next
If every marker comes back within reference range and you still have persistent post-lunch energy crashes, unexplained weight maintenance difficulty, or poor morning energy despite adequate sleep, the next step is not to accept “normal” as an answer. Request a calculation of your HOMA-IR (homeostatic model assessment of insulin resistance — a formula using your fasting glucose and fasting insulin together to estimate how insulin-resistant your cells actually are). A HOMA-IR above 1.9 in the context of “normal” individual markers suggests the system is compensating, not thriving. Also ask whether a continuous glucose monitor (CGM) — a small wearable sensor worn for 14 days that tracks blood sugar in real time — might be appropriate. Two weeks of CGM data will show you exactly how your glucose responds to meal timing changes in a way that a single fasting blood draw never can.
The Single Action: Your Next Step After Reading This Guide
At your next routine blood test, ask your doctor to include fasting insulin alongside your standard fasting glucose and HbA1c. If your fasting glucose looks borderline normal but your fasting insulin is elevated, that combination suggests your body is working harder than it should to manage blood sugar — and tightening your eating window to earlier in the day is a targeted intervention worth discussing. That single extra marker turns a generic metabolic checkup into a meal-timing-relevant data point.