Your Garmin knows your stress levels before you do. Your Oura ring has tracked your sleep for two years. And yet your doctor looked at your last blood panel, said everything was normal, and sent you home feeling no closer to an answer. The problem isn’t that your wearable data is useless — it’s that you don’t yet know which numbers to trust, which to treat as rough signals, and which to hand directly to a clinician who knows what to do with them.
That frustration is real, and it points to something structural. Your wearable is generating more health data about you than any previous generation has ever had access to. But data and insight are not the same thing. One is a stream of numbers. The other requires knowing which numbers are accurate, what they mean in context, and when they are pointing at something worth acting on. Right now, most people wearing these devices have access to the first and almost none of the second.
The Trust Problem: Why Your Wearable Data Feels Meaningful But Gets Dismissed At The Clinic
Think of your wearable like a sophisticated weather station mounted on your roof. It can tell you temperature, humidity, and wind speed with reasonable accuracy — and over time, those readings reveal meaningful patterns. But it cannot diagnose why your basement floods, tell you whether you have structural damage, or replace a building inspector. The data is real. The interpretation requires a different tool entirely.
The clinic dismissal problem is partly about format and partly about trust. Someone who has spent years watching their heart rate variability — the variation in time between individual heartbeats, a measure of how well your nervous system is recovering — trend slowly downward will feel that that is important information. And it may well be. But a doctor reviewing a one-off screenshot from an app they have never used, with no reference range, no comparison point, and no clear question attached, cannot do much with it. The data is not the problem. The presentation is.
What Doctors Actually Need Versus What Your Dashboard Shows
Your dashboard is optimised for engagement. It wants you to check it, feel good about closing your rings, and come back tomorrow. What a clinician needs is something different: a trend over time, a clear metric, a reference baseline, and a specific question. 67% of clinicians now review patient wearable data regularly, and 54% use it to inform treatment decisions — meaning the resistance is not universal, and the opportunity is real if you show up with the right information in the right format.
The Difference Between A Trend Signal And A Clinical Measurement
A trend signal tells you that something in your physiology has shifted over time. A clinical measurement tells you the precise value of a specific variable at a specific moment. Both are useful. They are not interchangeable. Wearable sensors give a more consistent and precise depiction of resting heart rate than point-in-time clinical measurements — because they capture you across hundreds of ordinary moments rather than one stressful appointment. That longitudinal advantage is your wearable’s real superpower. A single number it produces on a Tuesday afternoon is far less interesting than what that number has been doing for the past three months.
Metric-By-Metric: What To Trust, What To Use As A Signal, What To Ignore
Not all numbers on your dashboard carry the same weight. The central research question for wearable reliability is not whether the device measures something, but when that measurement can actually be trusted — and that answer changes dramatically depending on which metric you are looking at.
High Trust — Resting Heart Rate And Heart Rate Variability (HRV)
Resting heart rate — the number of times your heart beats per minute when you are completely at rest — is the metric your wearable handles best. The evidence is solid: continuous passive monitoring captures a truer picture of your cardiovascular baseline than any single clinical reading taken in a waiting room after you have rushed to get there. Heart rate variability, the beat-to-beat variation in timing that reflects how well your autonomic nervous system is recovering, is similarly reliable when tracked over time on the same device in the same conditions. Day-to-day HRV variation is noise. A multi-week directional shift is a signal worth paying attention to.
Medium Trust — Sleep Duration And Sleep Staging
Your wearable is reasonably good at tracking total sleep duration and detecting broad patterns — when you went to sleep, how long you stayed asleep, whether you were restless. Researchers identify the context and specific metric as critical decision points before trusting wearable data, and sleep staging — the breakdown into light, deep, and REM phases — is where consumer devices are weakest. The clinical gold standard for sleep architecture is a polysomnography test (a full overnight sleep study in a lab with electrode monitoring). Your Oura ring is not that. Use sleep staging data to notice trends, not to diagnose sleep disorders. If your deep sleep has been consistently low for months and you feel it, that is a reason to ask for a referral. It is not itself a clinical finding.
Medium Trust — Activity, Steps, And Exercise Intensity Estimates
Step counts and general activity levels are usefully directional. They tell you whether you moved more or less than usual, and over time they build a picture of your activity baseline. Exercise intensity estimates — the zones, the training load scores, the recovery readiness numbers — are more variable and more device-dependent. Use them as relative measures against your own history, not as absolute values you would stake a clinical decision on. Wearable nap metrics measured objectively have been found to help identify high-risk individuals for all-cause mortality outcomes — a reminder that even the passive, easy-to-overlook data streams can surface meaningful signals when tracked consistently over time.
Lower Trust — Blood Oxygen (SpO2) Readings From The Wrist
Blood oxygen saturation — the percentage of haemoglobin in your blood that is carrying oxygen (what clinicians call SpO2) — sounds like a precise clinical metric. From a wrist sensor, it is not. Consumer wrist-based SpO2 readings are prone to significant error from movement, skin tone, positioning, and ambient light. A medical-grade pulse oximeter clipped to your fingertip is a clinical tool. A wrist reading during sleep is a rough approximation at best. If your device is flagging low overnight SpO2 readings consistently, treat that as a reason to get a proper assessment — not as a confirmed result.
Frontier Territory — Continuous Glucose Monitors And Sweat-Based Biosensors
Continuous glucose monitors — devices that track blood sugar levels throughout the day without repeated finger-prick tests — are genuinely useful for people with diabetes and increasingly popular among optimisers who want to understand how food affects their glucose response. The accuracy of the established medical-grade CGM devices is well-documented. The newer, non-invasive versions that claim to measure glucose through the skin without a sensor filament are a different matter. A preliminary cohort study of 23 volunteers testing a non-invasive glucose monitoring wearable showed accuracy of 84.3% using a Clarke error grid — promising for a first-generation technology, but not yet at the threshold required for clinical decision-making. Sweat-based biosensors that claim to measure metabolic markers through perspiration are even earlier in the research pipeline. Watch this space carefully. Do not act on the numbers yet.
Why The Same Metric Can Be Accurate On One Person And Wrong On Another
How PPG Sensors Work — And Where They Break Down
Almost every metric your wrist-based wearable produces — heart rate, HRV, SpO2, stress scores — is derived from the same underlying technology: photoplethysmography (PPG), which works by shining light into your skin and detecting how much is absorbed or reflected by blood flowing through your capillaries. When your heart beats, blood volume in your wrist changes slightly, and the sensor reads those fluctuations as a pulse. It is an elegant piece of engineering. It is also a measurement made through skin, affected by everything that affects skin and the tissue beneath it.
Skin Tone, Fit, Movement, And Positioning: The Four Accuracy Killers
PPG sensor accuracy has known limitations during movement, in people with darker skin tones, and when fit is imperfect — and this is not a minor caveat. Higher melanin concentrations in darker skin absorb more of the green light that most PPG sensors use, which can degrade accuracy meaningfully. A loose wristband creates movement artefacts that the algorithm has to filter out — and sometimes cannot. Exercise, particularly activities involving wrist movement, introduces noise that can skew heart rate readings significantly. Your wearable’s accuracy is not a fixed property of the device. It is a variable that changes with your body, your activity, and how you wear it.
How Often To Check, How Long To Track, And When A Trend Becomes Actionable
The 90-Day Rule For Establishing Your Personal Baseline
One week of data tells you almost nothing useful. One month tells you slightly more. Ninety days of consistent data begins to reveal your actual personal baseline — what your resting heart rate genuinely is when you are healthy, how your HRV responds to stress and recovery, what your sleep looks like in a normal week versus a disrupted one. Wearable data is most powerful when used longitudinally — tracking your personal baseline over time — rather than as a single-point reading. Once you have that baseline, deviations from it become meaningful. Before you have it, you are mostly watching numbers without context.
Red Flags That Warrant A Clinical Conversation — Not Just More Data Collection
There is a trap that health-conscious wearable users fall into: treating every anomalous reading as a data quality problem to be explained away, and never taking it to someone who can investigate it. The following patterns in your wearable data are not things to watch for another month. They are reasons to book an appointment. A sustained rise in resting heart rate of more than five to ten beats per minute over several weeks, with no change in training load or obvious life stressor, is worth investigating. A consistent, multi-week decline in HRV that does not recover after rest days is worth discussing. Repeated SpO2 readings below 90% during sleep warrant proper assessment for sleep-disordered breathing. The data does not give you a diagnosis. But it gives you a reason to ask for one.
How To Bring Wearable Data To Your Doctor Without Getting Dismissed
The gap between what your wearable knows and what your doctor can act on is not primarily a technology problem. It is a communication problem. A clinician presented with a phone screen showing a colourful app dashboard has no structured way to evaluate it. The same clinician presented with a clear trend graph, a baseline reference, and a specific clinical question has something to work with. This is the difference between being dismissed and being heard — and it is entirely within your control.
The challenge is that this is exactly the kind of preparation a standard annual check-up was not designed to prompt. Not because doctors are indifferent, but because the appointment was built around the clinician’s workflow, not around your longitudinal data. Getting the most out of wearable data in a clinical context requires you to bridge that gap yourself.
What To Export, How To Present Trends, And What Question To Ask
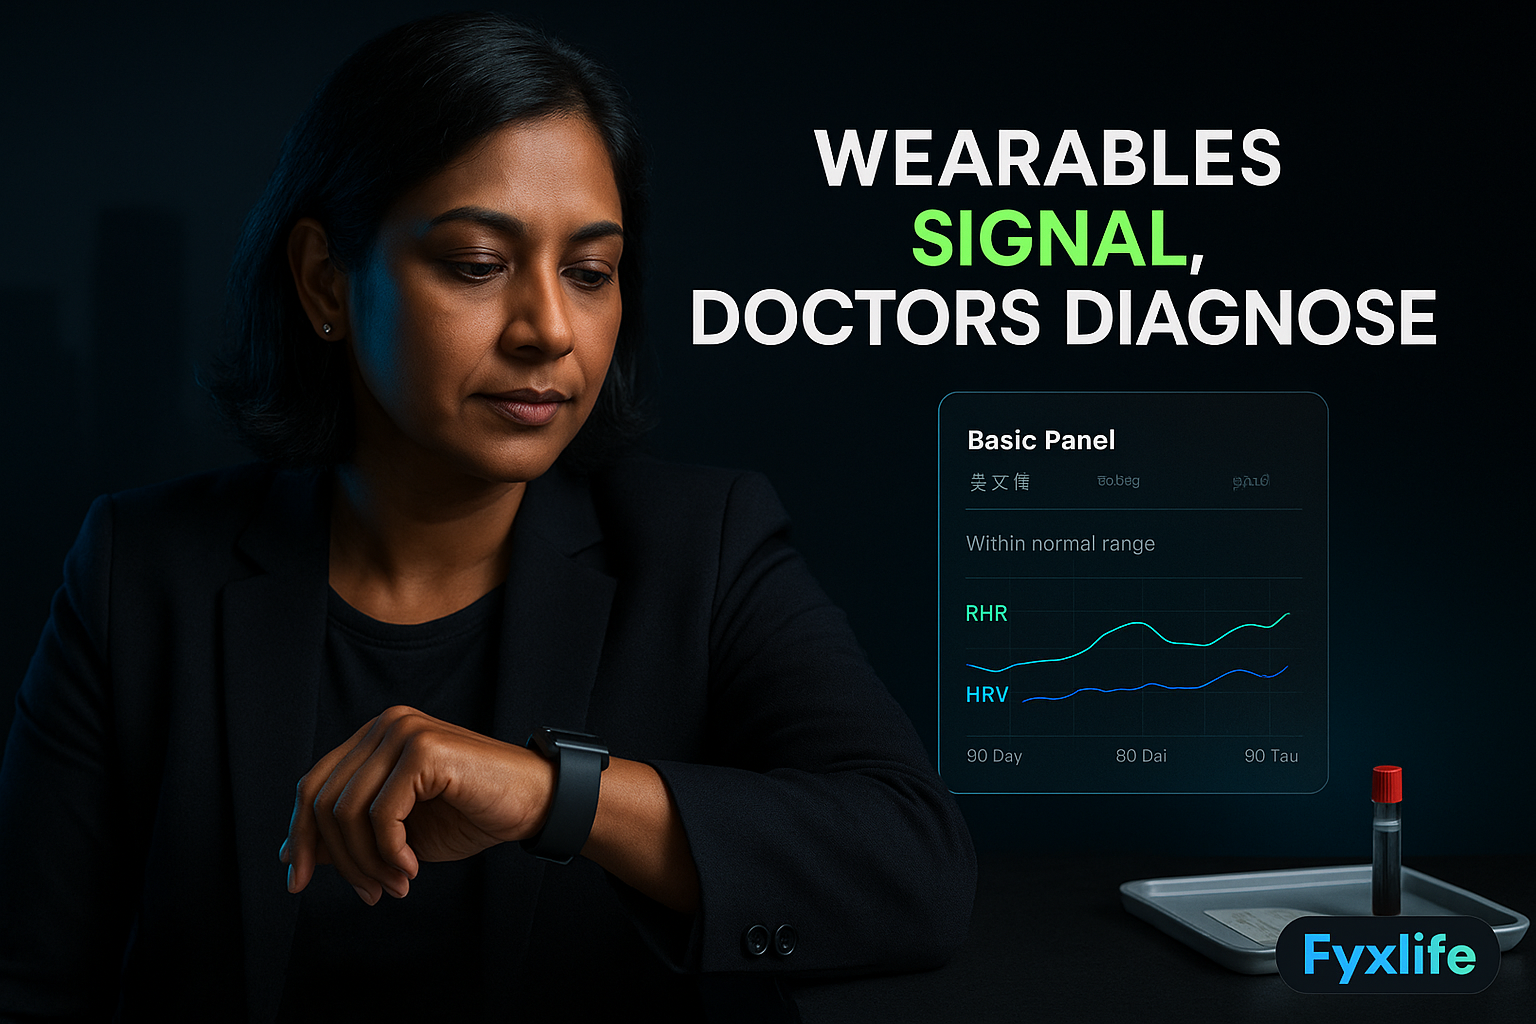
Most major wearable platforms — Garmin Connect, Oura, Apple Health, Polar Flow — allow you to export trend data as graphs or raw CSV files. A screenshot showing a 90-day resting heart rate trend is more useful than any verbal description. When you bring it to your doctor, lead with the trend, not the device. “My resting heart rate has risen by eight beats over three months with no change in training” is a clinical observation. “My Garmin thinks something’s wrong” is not. Frame the data around the physiological change, not the technology that captured it.
The Specific Biomarkers Your Wearable Data Should Prompt You To Test In A Lab
Your wearable is a hypothesis generator, not a diagnostic tool. Use it to direct laboratory testing, not to replace it. A sustained HRV decline and elevated resting heart rate together suggest your autonomic nervous system is under load — this warrants checking thyroid function (TSH and free T4), full blood count for anaemia, and a fasting cortisol level. Persistent fatigue showing up in your recovery scores despite adequate sleep duration warrants iron studies, ferritin, and vitamin D. Erratic overnight SpO2 readings point toward a formal sleep study referral. The wearable tells you where to look. The lab confirms what is actually there.
What Is Coming Next — And What It Cannot Do Yet
Non-Invasive Inflammation Tracking And Chemical Biosensors: Where The Research Stands
Non-invasive wearable biosensors for tracking inflammation markers represent an active area of scientific advancement, but current consumer devices do not yet reliably measure inflammatory biomarkers in real time. The ambition is significant: a wearable that could track C-reactive protein (CRP, the body’s primary marker of systemic inflammation) or interleukin-6 (a chemical signalling molecule that rises during immune activation) without a blood draw would be genuinely transformative. Wearable sensors are increasingly used to continuously measure analytes — measurable biological substances — from sweat and saliva, a capability previously limited to laboratory settings. Wearable chemical sensors are being actively researched for exploring novel non-invasive biomarkers in sweat and saliva — but researched is the operative word. None of this is available in a consumer device that you should be making health decisions based on today.
The One Thing No Wearable Can Replace
No sensor, however sophisticated, can replace the judgment that comes from looking at your specific combination of data — your wearable trends, your blood panels, your symptoms, your family history, your life context — and drawing a coherent clinical picture from it. The weather station on your roof gives you real readings. It does not tell you whether the structural crack in your basement appeared six months ago or six years ago, whether it is cosmetic or load-bearing, or what to do about it. That still requires a building inspector who has seen a lot of buildings. The best version of wearable use is not replacing that judgment. It is giving it better raw material to work with.
Before your next doctor’s appointment, export 90 days of your resting heart rate and HRV trend data from your wearable app as a screenshot or PDF. If either metric shows a sustained directional shift — not day-to-day variation, but a clear multi-week trend — bring it and ask your doctor: “My resting heart rate has risen by X beats over the past three months with no change in training load. Is this worth investigating with a blood panel or ECG?” That one framed question turns passive data collection into a clinical conversation.