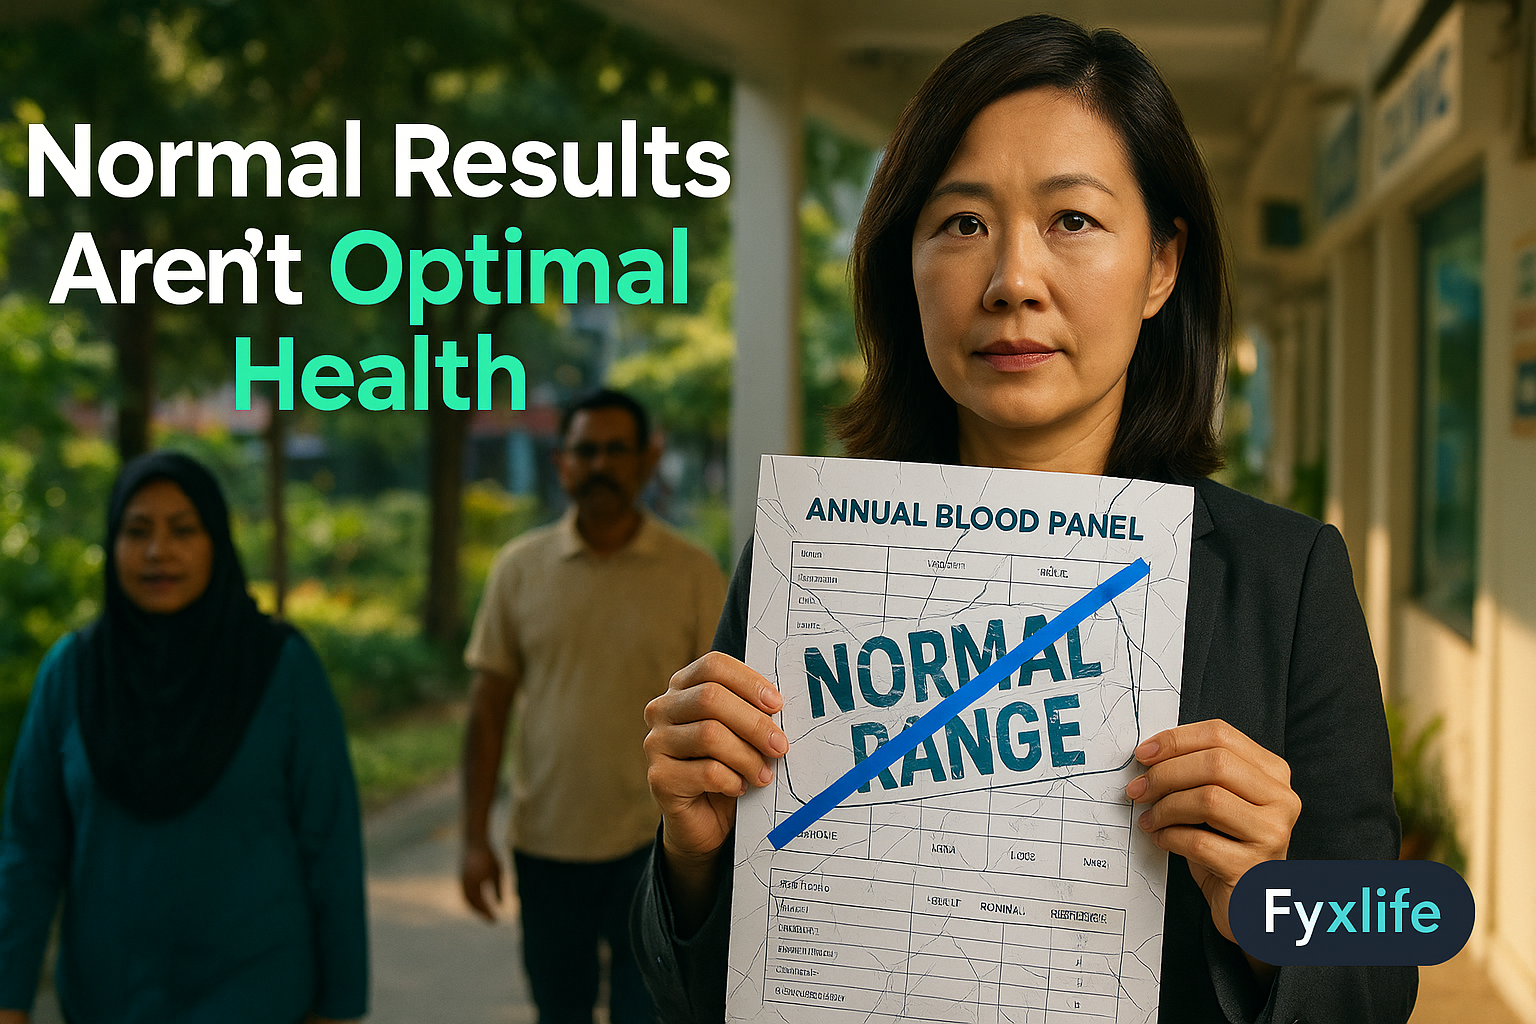
You felt something was off. You did the responsible thing and got tested. The results came back ‘normal’ — and somehow that felt like a dead end, not an answer. The myth that a standard annual blood panel tells you everything important about your health is one of the most consequential beliefs in preventive medicine, and the evidence suggests it is quietly wrong.
That frustration you feel holding a sheet of unremarkable numbers is not hypochondria. It is a reasonable response to a system designed to catch disease, not to optimise the decades before disease arrives. Understanding why the standard panel falls short — and what to do about it — is one of the highest-leverage things you can do for your long-term health.
The Myth — ‘If Your Blood Test Is Normal, You’re Healthy’
What a standard annual panel actually measures
A typical GP-ordered blood panel in Singapore or Southeast Asia covers the basics: a full blood count, fasting glucose, total cholesterol and its fractions, kidney and liver function markers, and sometimes thyroid function. These are genuinely useful. They will catch anaemia, flagrant liver dysfunction, poorly controlled diabetes, and severe lipid abnormalities. What they will not catch is the slow drift — the metabolic deterioration that takes years to cross a threshold and years more to become a diagnosis.
Think of your health as a long road trip. A standard annual blood test is like glancing at your dashboard once a year — it tells you whether the engine is currently on fire, but it won’t show you that your oil has been slowly dropping for six months or that your tyres have been losing pressure since January. What longevity medicine is trying to add is a continuous instrument panel: more dials, read more often, interpreted by someone who knows the difference between ‘not broken’ and ‘running well.’
How ‘normal’ reference ranges are constructed — and why they’re not the same as optimal
Reference ranges — the bracketed numbers on your lab report that define ‘normal’ — are not targets. They are statistical boundaries derived from large population samples, and those populations include people who are sedentary, metabolically compromised, or already in early stages of disease. When your result falls within range, it means you are not far from average. It does not mean you are anywhere near optimal. As longevity medicine experts have noted, ‘normal’ may be far from the physiologically optimal range that serious clinicians actually target when they are trying to preserve function over decades. Fasting insulin is a clear example: a result of 12 mIU/L sits comfortably within most labs’ reference ranges, yet longevity-focused clinicians often aim for levels closer to 5–8. That gap matters enormously — but your report will show no flag.
The Evidence Against It
Expert consensus identified 14 longevity-relevant biomarkers — most not on a standard panel
The scale of what standard testing misses is not speculation. A Delphi survey of biomarker experts — a structured process in which specialists independently rank and re-rank options across successive rounds — began with 460 distinct longevity-relevant markers and converged on just 14 consensus candidates. The majority of those 14 are not included in a routine GP panel. Markers like apolipoprotein B (a far more accurate measure of cardiovascular risk than standard LDL cholesterol), high-sensitivity C-reactive protein (a sensitive indicator of low-grade inflammation throughout the body), and insulin in the fasted state all carry strong evidence but rarely appear on standard orders unless you ask for them specifically.
A single snapshot vs. a trend line — why frequency changes what the data can tell you
Even when the right markers are tested, a single result has profound limitations. Research on serial biomarker monitoring consistently shows that single-point measurements cannot establish a meaningful individual baseline or detect change over time — and it is change that carries most of the predictive value. Your fasting glucose at 5.4 mmol/L looks unremarkable in isolation. But if it was 4.8 three years ago and 5.1 last year, you are watching a trajectory that deserves attention well before it crosses the diagnostic threshold for pre-diabetes. Statistical frameworks for biomarker interpretation distinguish sharply between the ability to predict a future outcome in general (called prognostic value) and the ability to predict how someone will respond to a specific intervention (called predictive value) — a distinction that only becomes visible across time, not in a single draw.
The implementation gap: markers with strong evidence that clinicians routinely skip
Here is the part that might frustrate you most. The problem is not only that the science is evolving — it is that evidence synthesis on clinical biomarker uptake found that implementation remains deeply inconsistent, with well-evidenced markers frequently not ordered unless patients specifically ask. Your GP is not negligent. They are working within a system optimised for acute care, not longevity optimisation. The barrier is structural, not scientific. That means the most effective thing you can do is walk in knowing what to ask for.
The Counter-Myth to Avoid — More Tests Isn’t Always Better
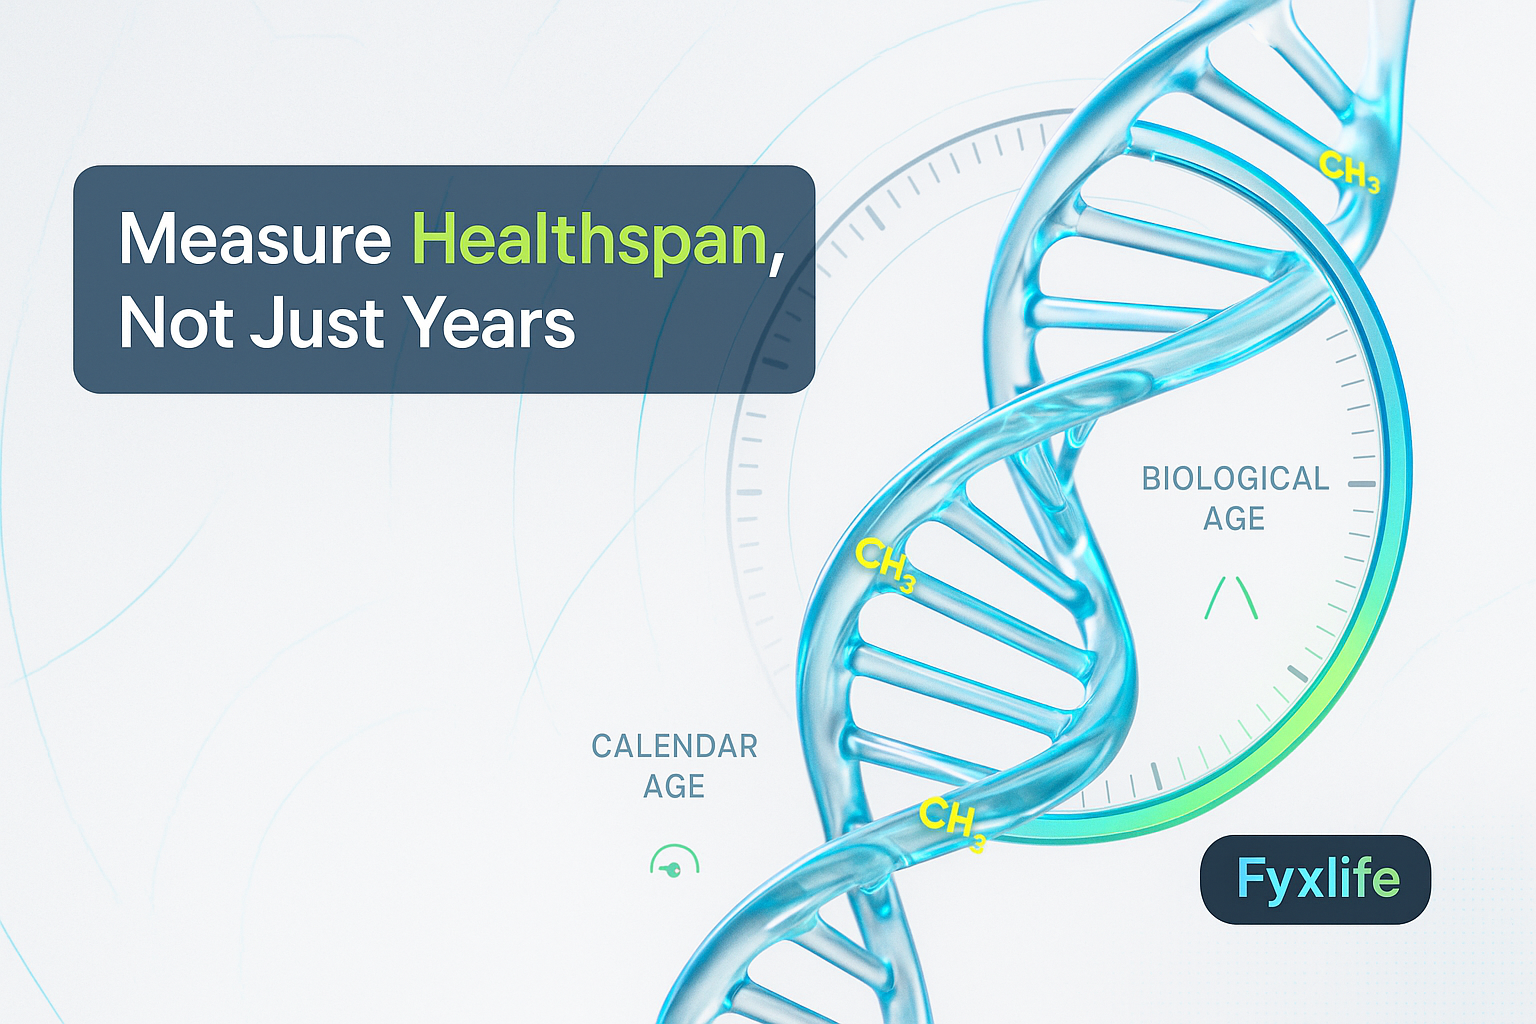
Why biological age clocks and microbiome tests are not yet actionable for most people
Having argued that standard testing is insufficient, it is equally important to say this clearly: not everything marketed as advanced longevity testing deserves your money or your anxiety. Biological age clocks — algorithms that attempt to estimate your physiological age from methylation patterns or other molecular signals — and microbiome composition tests are two categories attracting enormous consumer interest right now. A rigorous review by longevity researcher Matt Kaeberlein concluded that neither is yet reliable or actionable for most consumers, despite the marketing claims surrounding them. The science is genuinely interesting. The clinical utility, at this moment, is not there.
Similarly, current clinical guidelines explicitly recommend against routine APOE genetic testing — screening for the gene variant most associated with Alzheimer’s risk — and against Alzheimer’s disease biomarker testing in cognitively unimpaired adults. Knowing a result and knowing what to do with it are entirely different things, and the harm from the former without the latter is real.
The consumer testing gold rush and what it gets wrong
Consumer platforms have done something genuinely valuable: they have made biomarker testing accessible without a GP referral. But access is not interpretation. As the Longevity Docs newsletter has noted, the gap between receiving a result and understanding what to do with it is where most people encounter real risk — the risk of over-reacting to a normal variation, or under-reacting to a signal that genuinely matters. The same source projects that tracking 150 to 200 biomarkers per person may become routine in longevity medicine within five years, but also notes the clinical infrastructure to interpret that volume meaningfully does not yet exist at scale. More data without better interpretation is not progress.
The Verdict — What Testing Frequency and Marker Selection Should Actually Look Like
The tier system: what to test annually, what to test every 6 months, and what to ask about specifically
A rational approach sits between the inadequacy of the standard annual panel and the noise of overtesting. Annually, you want the standard panel covered — but extended to include apolipoprotein B in place of or alongside standard LDL, high-sensitivity C-reactive protein as a window into systemic inflammation, fasting insulin, and HbA1c (a three-month average of blood glucose control). Every six months, if you have any metabolic risk or family history of cardiovascular disease, lipids and glucose deserve a closer watch — because trajectory over two data points per year is meaningfully richer than one. Specific markers to raise with your doctor include Lp(a), or lipoprotein(a), a genetically determined cardiovascular risk factor that a standard cholesterol panel entirely omits, and DHEA-S as a broad indicator of hormonal aging. It is also worth noting that of 25 lifestyle and environmental factors studied for influence on biological aging, only a small subset — including smoking, physical activity, and socioeconomic conditions — had the strongest measurable effect on mortality and aging trajectories. Testing tells you where you are. Behaviour determines where you go.
The five questions to bring to your next GP appointment
- Can we add apolipoprotein B and Lp(a) to my lipid panel this year?
- Can we include fasting insulin and high-sensitivity C-reactive protein?
- What were my results two or three years ago, and are any markers trending in a direction we should watch?
- Is my result within the population normal range, or within the optimal range for someone my age who wants to avoid disease in the next 20 years?
- Are there any markers you consider important that are not currently covered by my standard panel?
The One Belief to Drop Today
The belief worth discarding is not that testing matters — it clearly does. The belief to drop is that a normal result is a complete result. Normal means you are not currently in crisis. It says almost nothing about the direction you are heading, the gap between your current markers and optimal function, or what a longevity-focused clinician would flag as worth addressing now. The standard panel is a starting point. It was never designed to be a finish line.
At your next blood test appointment, ask your doctor one specific question: ‘Is this result within the normal population range, or is it within the optimal range for someone my age who wants to avoid disease in the next 20 years?’ If your doctor cannot distinguish between those two answers, you now know what to investigate next.