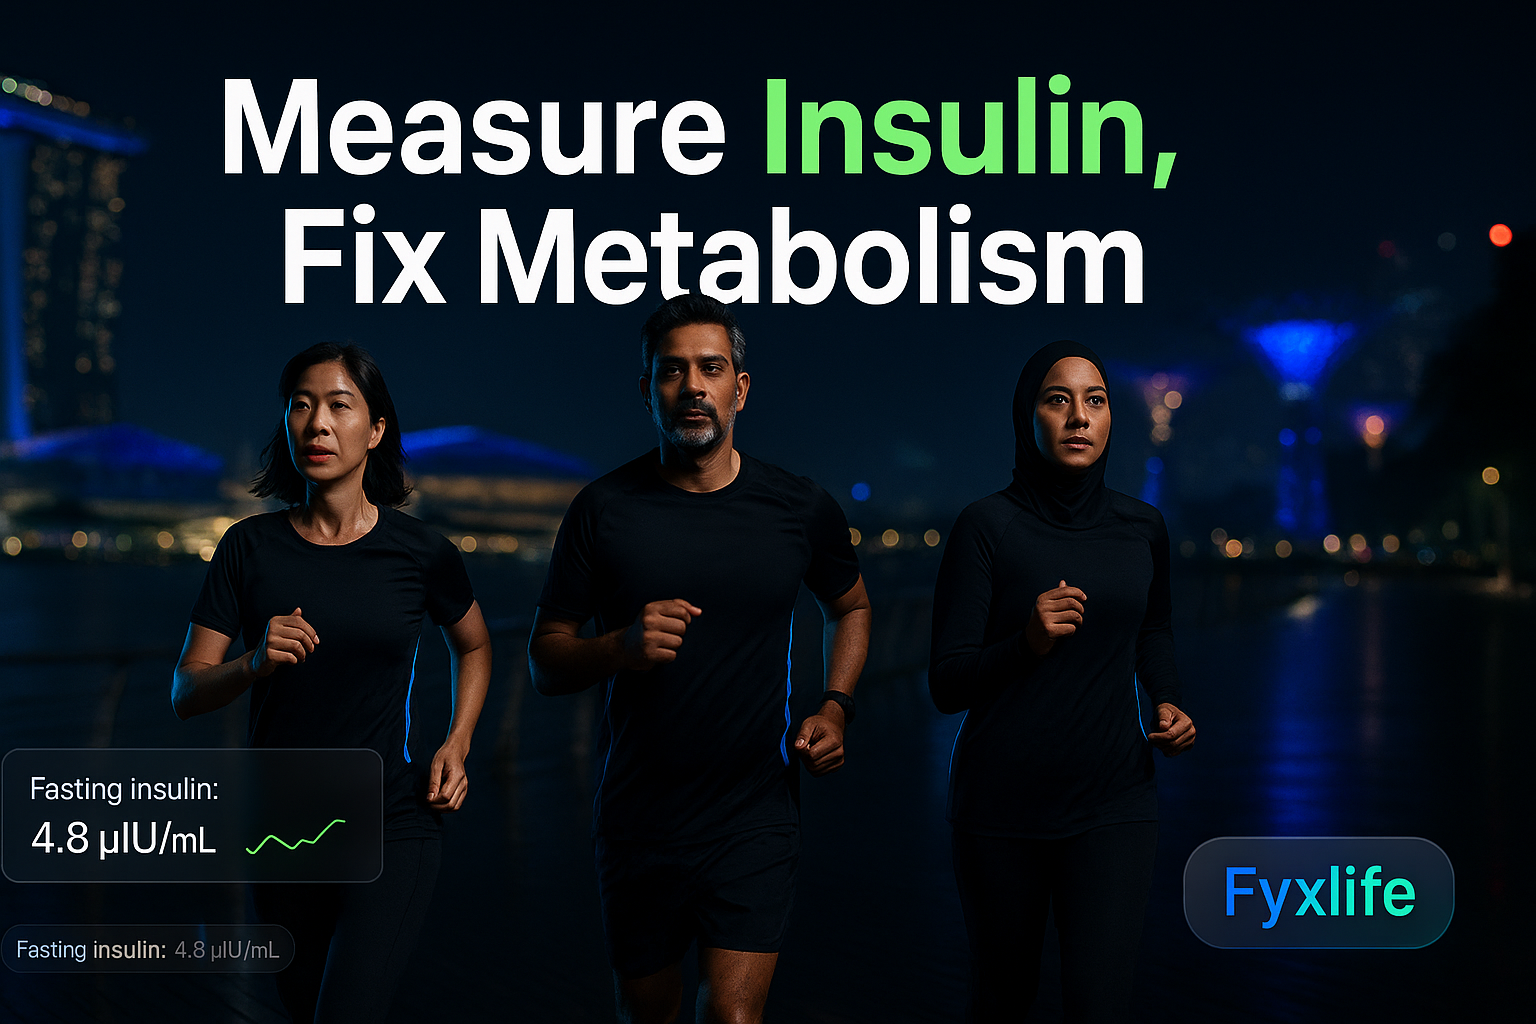
Your last blood test came back ‘normal’ — fasting glucose fine, HbA1c fine, cholesterol borderline but manageable. And yet something still feels off: energy crashes after meals, stubborn weight around the middle, a tiredness that sleep doesn’t fix. The problem isn’t that you’re fine. The problem is that you’re being measured with the wrong ruler. Fasting insulin is the test that catches metabolic dysfunction years before standard markers move — and most routine panels in Singapore don’t include it.
That gap between feeling off and having something to point to on paper is one of the most frustrating places to be. You’re not sick enough for the system to pay attention, but you’re not well enough to stop wondering. The good news is that the information you need exists. You just have to know which test to ask for, how to prepare for it properly, and what the numbers actually mean once they come back.
Why Your Standard Blood Panel Is Measuring the Wrong Thing
The gap between ‘normal’ and optimal — what lab ranges aren’t telling you
Lab reference ranges are built from population averages. They tell you where most people fall — not where you want to be. When a lab flags a result as ‘normal’, it means you are somewhere within the range of the general population tested. It does not mean you are metabolically healthy. It does not mean your risk is low. It means you are not yet an outlier. For a population where metabolic dysfunction is increasingly common, that is a low bar.
The distinction matters most with insulin. Fasting insulin detects metabolic dysfunction years before glucose or HbA1c rise, and the optimal threshold for longevity purposes sits below 5 μIU/mL — well below the upper reference range most labs use, which is typically set much higher. A result of 12 μIU/mL might come back with no flag. That does not make it a good number.
How insulin resistance develops silently while glucose stays ‘normal’ for years
Think of insulin like a key that unlocks your cells to absorb glucose. Insulin resistance is what happens when the locks get stiff — your body has to make more and more keys just to get the same door open. Fasting glucose measures how much sugar is still circulating in the hallway. Fasting insulin measures how frantically your body is producing keys to deal with it. By the time glucose rises, the locks have been stiff for years. Fasting insulin catches the problem while glucose still looks perfectly fine.
This is not a theoretical distinction. Elevated fasting insulin is a precursor to insulin resistance and is rarely tested in routine metabolic panels, despite being a valuable early indicator of metabolic health decline. Your pancreas can compensate for stiffening locks for a long time — producing more insulin to keep glucose in range. The glucose number stays clean. The insulin number quietly climbs. Standard panels only measure one of those two things.
The Tests to Request (And What Each One Measures)
Fasting insulin — the anchor test
This is the test the article is built around, and the one most likely missing from your current panel. Fasting insulin measures how well the body manages glucose, and elevated levels can signal early metabolic dysfunction even when other markers appear normal. It requires a single blood draw after an overnight fast and costs relatively little to add to an existing panel. The information it provides is disproportionate to the effort involved.
Fasting plasma glucose — a necessary companion
Fasting glucose is almost certainly already on your panel. On its own, it is a late signal. Paired with fasting insulin, it becomes the second coordinate you need to calculate your insulin resistance score. In high-risk populations, fasting plasma glucose is recommended as a screening test for early detection of diabetes and pre-diabetes — but its real value in this protocol is as the denominator in the HOMA-IR calculation described below.
HbA1c — the 90-day average
HbA1c (glycated haemoglobin) reflects your average blood glucose over the past two to three months. It smooths out daily variation and gives you a broader window into how your glucose has been behaving. It will not tell you what is happening with your insulin, but it adds important context. An HbA1c creeping toward the upper end of ‘normal’ — even at 5.5% or 5.6% — alongside a rising fasting insulin tells a more complete story than either number alone.
Oral glucose tolerance test (OGTT) — the stress test for your metabolism
The oral glucose tolerance test involves drinking a standardised glucose solution and having your blood drawn at intervals — typically at fasting baseline, then at one and two hours — to see how your body handles a real glucose load. It is the most diagnostic of the group. Where fasting insulin shows you the resting state of your metabolic machinery, the OGTT shows you how that machinery performs under pressure. Some people have normal fasting numbers but a distinctly abnormal glucose response at the two-hour mark — a pattern that fasting tests alone would miss entirely.
HOMA-IR — how to calculate your insulin resistance score from two numbers
HOMA-IR (the Homeostatic Model Assessment of Insulin Resistance) converts your fasting insulin and fasting glucose into a single number that quantifies how resistant your cells are to insulin. The formula is straightforward: multiply your fasting insulin (in μIU/mL) by your fasting glucose (in mmol/L), then divide by 22.5. A single fasting blood sample taken after an overnight fast is used for determination of both blood glucose and plasma insulin in this standard insulin sensitivity assessment procedure. You do not need a doctor to run this calculation — you need two numbers from the same fasting draw.
The Fasting Protocol — How to Prepare So Your Results Are Actually Valid
The minimum fast: 8–10 hours overnight, nothing but water
This is non-negotiable. Blood for fasting plasma glucose and insulin analysis should be drawn in the morning after the individual has fasted overnight for at least 8 hours. Anything eaten during that window — including coffee with milk, a small snack, or a protein shake — triggers an insulin response that will contaminate your fasting result. The test is not just measuring your baseline state. It is measuring your baseline state under specific, controlled conditions. Deviate from those conditions and you are not running the same test anymore.
One real-world reminder worth taking seriously: people have completed their insulin resistance tests without fasting, then questioned whether all their results were meaningless. The answer is: yes, largely. Test preparation is not background detail. It is the test.
Morning draw only — why timing matters
Insulin follows a circadian rhythm — it is not constant throughout the day. Fasting for 10–12 hours overnight is the standard preparation procedure used across most metabolic studies as the baseline preparation requirement, and that baseline is calibrated for a morning draw. An afternoon fasting insulin, even after 10 hours without food, is not directly comparable to morning reference ranges. Book the earliest appointment available and go straight from home.
What to avoid the day before: intense exercise, alcohol, late meals
Hard training the evening before can affect glucose metabolism into the following morning. Alcohol impairs glucose regulation and can suppress or distort insulin readings. A large or late meal the night before extends the time your body needs to return to a true fasting state. None of these things will ruin your results catastrophically, but they introduce noise — and when you are trying to detect subtle early signals, noise is the enemy.
During a glucose tolerance test: stay seated, no smoking, no food
The oral glucose tolerance test should be performed after a 10- to 16-hour fast in ambulatory outpatients, and patients must remain seated with smoking avoided during the test. Physical movement raises glucose uptake in muscles independently of insulin — which is exactly the mechanism you are trying to measure in isolation. Walking around the clinic between blood draws skews the result. The protocol requires stillness precisely because movement is a variable.
How to Read Your Results Without a Medical Degree
Fasting insulin — what below 5, 5–10, and above 10 μIU/mL each signal
Below 5 μIU/mL is where you want to be. This is the longevity-optimised threshold — not the lab’s standard upper reference range, which is typically set much higher and reflects population averages rather than optimal metabolic function. A result in this range suggests your cells are responding well to insulin and your pancreas is not working overtime to compensate.
Between 5 and 10 μIU/mL sits an important grey zone. Your result will likely come back with no flag. But this is the range where early insulin resistance is developing — where the locks are starting to stiffen but your glucose is still being kept in range by increased insulin output. This is the window where intervention has the most leverage. Above 10 μIU/mL, particularly alongside fasting glucose that is still technically normal, is a clear signal that your metabolic machinery is under significant compensatory strain.
HOMA-IR — calculating your score and what it means
Run the calculation yourself: fasting insulin (μIU/mL) × fasting glucose (mmol/L) ÷ 22.5. A HOMA-IR below 1.0 is considered optimal. Between 1.0 and 1.9 suggests mild insulin resistance beginning to develop. Above 2.0 indicates meaningful insulin resistance; above 2.9 places you in the range associated with significant metabolic risk. These thresholds are not perfect — they are population-derived estimates — but they give you a single number to track over time as you make changes.
The pattern that matters: insulin rising while glucose is still normal
The most important thing to look for is the combination, not either number in isolation. Rising fasting insulin alongside stable or normal fasting glucose is the metabolic fingerprint of early insulin resistance — your pancreas compensating successfully enough to keep glucose in range, but at a cost that is unsustainable over time. This pattern is invisible to standard panels. It is exactly what this protocol is designed to detect.
What NOT to Do (Common Mistakes That Waste Your Test)
Testing without fasting — why the result is meaningless
If you eat before the draw, you are measuring your post-meal insulin response, not your fasting baseline. The reference ranges the lab uses — and the HOMA-IR formula — are calibrated for fasting conditions. A non-fasting insulin result cannot be compared to those ranges. It is not a slightly inaccurate fasting insulin. It is a different measurement of a different thing. Confirm your fasting status with the person drawing your blood before the needle goes in.
Accepting ‘normal’ as optimal without checking the threshold used
Ask your lab what upper reference range they are using for fasting insulin. If the answer is above 25 μIU/mL — which is common — a result of 15 μIU/mL will come back with no flag despite representing a significant metabolic problem by longevity standards. The reference range is not a biological target. It is a statistical boundary derived from a population. Know the difference.
Testing once and never retesting — why a single snapshot misses the trend
A single fasting insulin result tells you where you are. Two results, six to twelve months apart, tell you which direction you are heading. The trend matters more than the absolute number, particularly when you are making lifestyle changes. Fasting insulin responds to real interventions — sleep quality, meal timing, movement — but the response takes weeks to months to show up reliably in a blood draw. One test is a baseline. The second test is the data.
How to Talk to Your Doctor in Singapore About Ordering These Tests
Exact language to use when requesting fasting insulin
Be direct and specific. “I’d like to add fasting insulin to my next blood panel — I want to calculate my HOMA-IR alongside my fasting glucose.” Most GPs will accommodate this without hesitation. If you want the full metabolic picture, ask for fasting insulin, fasting glucose, and HbA1c together, and mention that you’re interested in an oral glucose tolerance test if your numbers warrant it. The challenge is that this is exactly the kind of question a routine annual check-up was not designed to answer in depth — not because doctors don’t care, but because a 10-minute appointment built around population-level screening was never structured to interpret the nuance between your fasting insulin at 8 μIU/mL and your optimal target below 5.
What to do if your doctor declines — private lab options in Singapore
Fasting insulin is available as a standalone test at several private laboratories in Singapore including Raffles Medical, Healthway, and independent diagnostic labs such as Innoquest and Sonic Healthcare. You can walk in, request the test, fast appropriately beforehand, and receive results without a GP referral in most cases. The out-of-pocket cost is modest — typically under S$30 to S$50 for fasting insulin alone. Bring the result to your next GP appointment and ask for the HOMA-IR interpretation in context of your fasting glucose.
After the Results — Setting a Baseline and Planning a Retest
Lifestyle variables that move fasting insulin: sleep, timing of eating, movement
Fasting insulin responds to modifiable behaviour more readily than most metabolic markers. Consistently poor sleep — under six hours, or fragmented sleep — raises fasting insulin independently of diet. Compressing your eating window, even without reducing overall calories, tends to lower it. Low-intensity movement after meals — a 10-minute walk — meaningfully blunts the post-meal insulin spike that accumulates over time into elevated fasting levels. These measurable shifts in fasting insulin and HOMA-IR after consistent intervention are well-documented, and represent the clearest feedback loop available for tracking metabolic improvement over time. None of these require a supplement or a device. They require consistency.
When to retest and what improvement looks like on paper
Retest after three to six months of consistent change. A meaningful improvement is a fasting insulin drop of two to three μIU/mL or more, paired with a HOMA-IR moving toward or below 1.0. Do not expect dramatic shifts in six weeks — the pancreatic and cellular adaptations that move these numbers take time. What you are building is a longitudinal record: a first result, a second result after intervention, and a direction of travel you can see clearly on paper. That record is worth more than any single test.
Before your next routine blood draw, add this one request: ask your GP or clinic to include fasting insulin alongside your standard fasting glucose. If your fasting insulin comes back above 5 μIU/mL — even if your glucose is ‘normal’ — that single data point is worth a follow-up conversation about HOMA-IR calculation and whether an oral glucose tolerance test is warranted. One extra line on the order form. One number that changes what you’re actually measuring.